Audit section
The Audit section allows you to view all the changes made to the nevisDetect system.
The Audit section contains one screen: Audit log.
Audit log
The Audit log screen shows all changes made to the application settings. You can use this screen to review the changes in the application settings, or to find out why the system does not behave correctly.
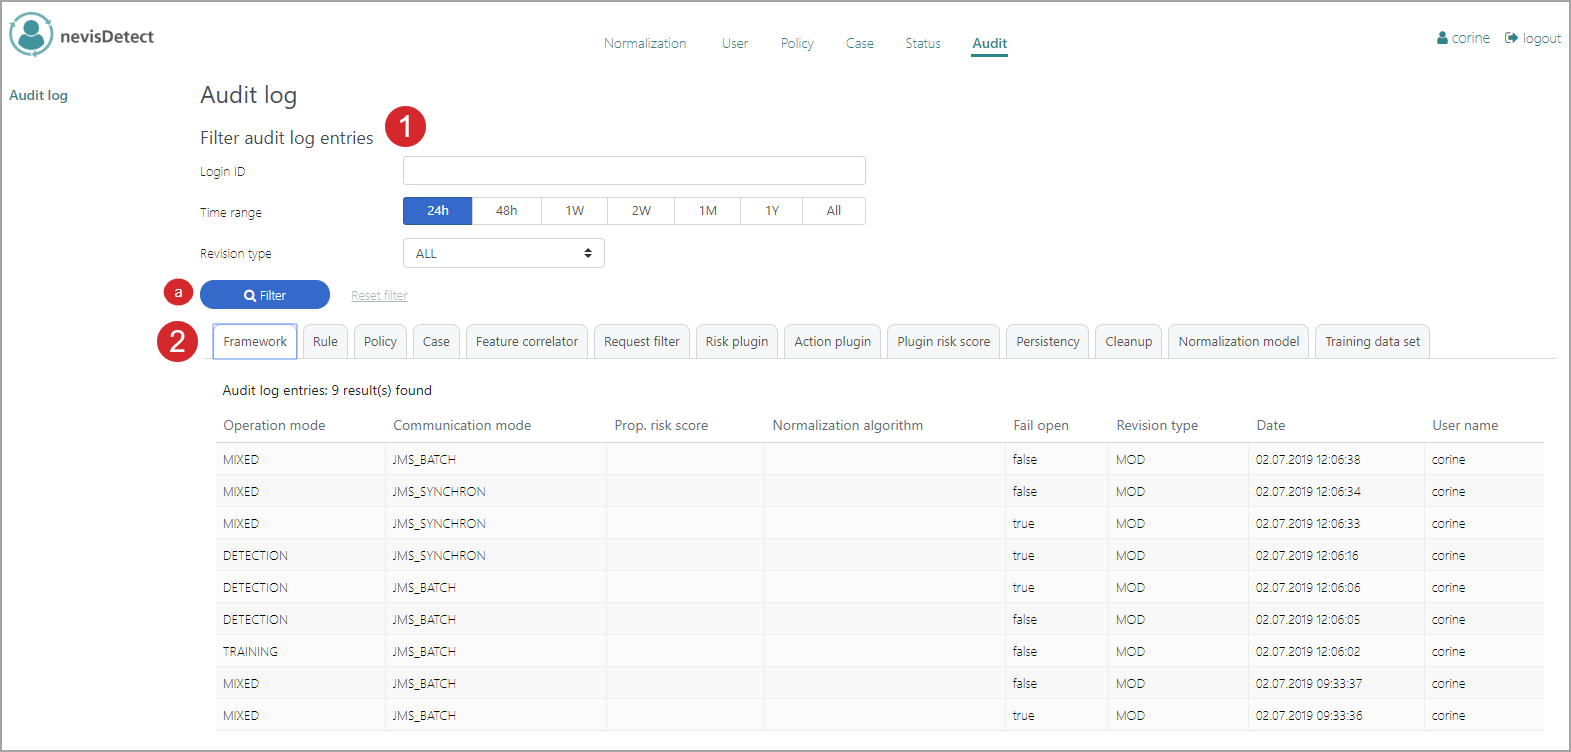
The Audit log screen consists of several parts (see the figure above - the numbers in the figure correspond with the numbers below).
- You can filter the audit logs either by login ID, time range or revision type (MOD: modification, DEL: deletion, ADD: creation, ALL: all).
- Click Filter to show the list of audits that fulfill the filter criteria.
- The results are shown in a table and ordered by modification date (descending). The tabs on top of the table represent the categories of audit log entries. For an overview of all tabs, see Available log entries. Which results you see in the table depends on the tab you select.
- The first columns of each log entry show data that is specific for this tab. For example, the previous figure shows the log entries for the Frameworktab. Here, the first columns describe modifications in the operation and communication modes.
- The last three columns are always the same for each log entry, independent of the selected tab:
- Revision type of the entry: MOD for modification, DEL for deletion and ADD for creation.
- Date: The date of the change.
- User name: The user who made the change. This can also be a technical user.
Available log entries
The following categories of log entries, or tabs, are available:
Framework: Contains the changes of the general application settings such as operation mode, communication mode or the normalization algorithm.Rule: Choose this tab to see who activated/deactivated a rule or changed the action related to the rule. It also shows the creation of the rules by the system.Policy: Shows all changes related to the policies, including the policy ranges.Case: Lists the creation of cases by the system as well as all the modifications made to these cases by the users, such as changing the name of the case, adding notes or tags.Feature correlator: Select this tab to see if someone enabled/disabled the request processing.Request filter: Displays all changes of the request filter management.Risk plugin: Shows when and which Risk plug-in was loaded by the system, and/or whether a user enabled/disabled any of them on the UI.Action plugin: Shows when and which Action plug-in was loaded by the system, and/or whether a user enabled/disabled any of them on the UI.Plugin risk score: Shows all modifications of the risk score normalization, including the loading of the defaults by the system during plug-in loading.Persistency: Shows the changes in the configurations for the cleanup of the request and risk score history.Cleanup: Lists the logs of the cleanups executed by the system (cron job) or the users, including the statistics of the deleted sessions and requests.Normalization model: Lists all log entries related to normalization models. Each entry includes information about the model name and the used algorithm.Training data set: Lists all log entries related to training data sets. Each entry includes information about the data set name and the time frame.