Helper tools
isiweb3loadchart
Deprecated
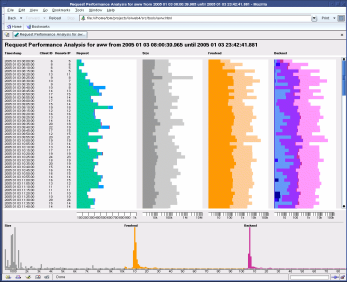
The Perl script isiweb3loadchart is deprecated and will be removed in a future release.DescriptionThe isi3webloadchart.pl script helps to analyze the load on a nevisProxy server by means of information from its log files. It generates HTML files that may be displayed in any browser supporting frames. According to the order of magnitude of smallest to biggest value, a linear or logarithmic scale is used. On the mouse over a chart additional information is displayed.
- Session# Average amount of authenticated clients
- IP# Average amount of remote IP-addresses
- Thread# Average amount of active threads
- Request# Average amount of requests and their status codes They are displayed sorted according to their status code, one by one.
- Size Average and maximal size of request in bytes
- Frontend Average and maximal time consumed in frontend in ms
- Backend Average and maximal time consumed in backend in ms The total time is split into:
They are displayed sorted according to their values, the smaller in front of the bigger.
Configuration To make nevisProxy trace the required information, set the trace groups IsiwebOp and NavajoOp to an absolute level of 6. This causes nevisProxy to write two lines per request, which may result in huge log files. Log file rotation is therefore highly recommended.
You may use the following settings in your bc.properties file:
BC.Tracer.ThresholdBase=5
BC.Tracer.MaxLogFileVersions=5
BC.Tracer.MaxLogFileSize=10000000
BC.Tracer.TimeFormat=detailed
BC.Tracer.DebugProfile.NavajoOp=1
BC.Tracer.DebugProfile.IsiwebOp=1
Usage
isi3webloadchart.pl [-sizeInterval
<time>] logfile...
timestamp = yyyy mm dd hh:mm:ss.sss
time = hh:mm:ss
The following options are supported:
-s[tart]
Moment to start the analysis. Format: yyyy mm dd hh:mm:ss.sss. Default: start of log file.
-e[nd]
Moment to end the analysis. Format: yyyy mm dd hh:mm:ss.sss. Default: end of log file.
-p[eriod]
Sampling rate. Requests during this period are collected for the statistic. Default: 1:00 = 60 s
-si | sizeInterval
Defines the interval for the distribution of the size. Default: 100 B
-fi | frontendInterval
Defines the interval for the distribution of the time used in the frontend. Default: 10 ms
-bi | backendInterval
Defines the interval for the distribution of the time used in the backend. Default: 10 ms
-n[ame]
Specifies the name of the HTML file. Default: navajo Example Analyze the log files in directory ./logs with a sampling rate of 5 minutes.
isi3webloadchart.pl -period 5:00 -name Example ./logs/navajo.log*
isi3webstat
Deprecated
The Perl script isi3webstat is deprecated and will be removed in a future release.
The isi3webstat.pl script allows to generate text file reports to analyse the performance of nevisProxy and the configured backend applications. To make nevisProxy trace the required information, set the trace groups IsiwebOp, NavajoOp and NavajoHttpSess to an absolute level of 6.
Usage
cat <log files> | isi3webstat.pl
[-slow-threshold <time>]
[-sess-threshold <ms>]
The following options are supported:
-period
Time slice interval. Format: sec | min | hour | day. Default: none.
-format
Format of the generated report. You can choose between a histogram report ('histo'), a list report ('list') or a summary report ('summary').
-slow-threshold <ms>
Report calls slower than the specified amount of milliseconds. Default: 10'000
-connect-threshold <ms>
Report connects slower than the specified amount of milliseconds. Default: 20
-thread-threshold
Warn when concurrency reaches maximum.
-sess-threshold
Warn when session usage reaches maximum.
Real-time statistics
Real-time request statistics may be collected using the qslog http://opensource.adnovum.ch/mod_qos/qslog.1.html utility. This utility has to be configured within the navajo.xml as shown in the template that comes with the nevisProxy package. qslog collects request statistics (req/sec, bytes/sec, status codes, response times, memory consumption, server load) every minute and writes the collected data to the configured log file.
bin2hex
Usage:
bin2hex <in>
It prints out the hexadecimal representation of <in>. For example:
> bin2hex "ABC"
414243