Reference guide
nevisReports provides detailed reports on the usage of your Nevis Security Suite. It is fully integrated into the suite and handles data collection, indexing, business report creation and report distribution.
nevisReports has many customization options. It can be tailored to the requirements of any organization that wants to analyze the usage patterns of its Nevis environment.
Comprehensive data is collected from nevisProxy, nevisAuth and nevisIDM and indexed to optimize retrieval speed. Databases backing nevisIDM or nevisWorkflow are assessed directly as well for information retrieval.
Key features of nevisReports
- Filtering and sorting controls are available for every tabular report.
- Reports can be delivered in Excel, PDF, web page, and other formats.
- Report visibility can be restricted to specific user groups. Full integration with Nevis IAM and SSO is supported and recommended.
- Authorized users can in
- Distribution of reports to authorized users is supported via a user-friendly web interface, via e-mail or via file shares.
- Near real-time reporting is available to get reports with the latest data anytime.
- Support for visually appealing and detailed governance dashboards that provide an easily understandable overview of the main components of the Nevis Security Suite.
- The software is delivered as a nevisAppliance, ensuring fast installation and maintenance.
- If needed, Nevis integrators can develop and deploy custom reports and dashboards to fulfill specific customer needs.
Browser support
For an overview of all supported web browsers, see the chapter Browser Support Policy in Nevis in the guide "Nevis Product Lifetime and Platform Support Matrix".
Quick Start
nevisReports provides a web application for dashboards and to generate or schedule reports. End users can access this Nevis-protected application from their web browser.
Functionality provided by the reporting application
You can perform the following tasks using the reporting application:
- browsing/searching the library for available report definitions,
- generating and viewing a dashboard,
- generating a report from a report definition,
- changing a report's filter or display settings,
- scheduling a report for delivery via e-mail or for local storage in the reports repository, and
- managing the reports repository.
The action of "generating a report" is also called "running a report" or "executing a report". Dashboards and its charts are a specific kind of report.The nevisReports application is a tailored version of the JasperReports Server (JRS) product. See the JRS 6.4 User Guide for information on the user interface, in particular the following sections:
- "The Library Page"
- "Running Reports and the Report Viewer"
- "Browsing the Repository"
JRS provides various other features that are disabled in the nevisReports user interface. The reason is that they are incompatible with the nevisReports architecture. Examples of disabled features: ad hoc reports, domains and online administration of users and report definitions. The administration features are instead provided via command-line scripts and via nevisIDM.
Report and dashboard generation
When the user generates a report or opens the dashboard, the following events occur:
- nevisReports retrieves the requested report definition from the repository.
- nevisReports executes the report definition. This includes
- The results are rendered in the desired format and delivered as a report or chart on a dashboard.
A report definition contains
- the set of steps to execute, such as querying a database for log data or calculating statistical measures on this data, and
- the specification of the report's presentation (layout), i.e., the way results are shown in the web browser or exported to PDF or other formats.
If a user changes the filter and display settings of a report, it is possible to save the new settings and thus create a personal copy of the report definition. This copy can be used later on to generate or schedule reports with the same settings.
Users and roles
By default, nevisReports provides the following user accounts:
| User name | JRS role | Password | Description |
|---|---|---|---|
| superuser | ROLE_SUPERUSER | random, generated at installation time | Overall system administrator who does not belong to any organization.This account can't be used to view or execute reports or dashboards. nevisReports uses this system account for a limited set of maintenance tasks only. It is not managed in nevisIDM. |
| jasperadmin | ROLE_ADMIN | random, generated at installation time | Administrator of the default organization (organization_1).nevisReports uses this system account for a limited set of maintenance tasks only. It is not managed in nevisIDM. |
| testuser | ROLE_USER | testuser | Test user of the default organization.This account is meant for testing purposes only and must be removed in production environments ). This account is not managed in nevisIDM. |
<any> | ROLE_USER | A reporting end user of the default organization, which is managed in nevisIDM and created automatically when he access the reporting application via nevisProxy.See Configuring JasperReports Server for details. |
JRS supports multiple organizations as part of its multi-tenancy feature. This feature is not enabled for nevisReports, so reporting users always belong to organization_1.
Timezone
All dates and times displayed in reports or on the dashboard are in the same timezone as the nevisReports server.
Standard reports
The standard reports are generic reports that work out of the box for most Nevis installations. It is possible to customize the reports to meet specific customer requirements.
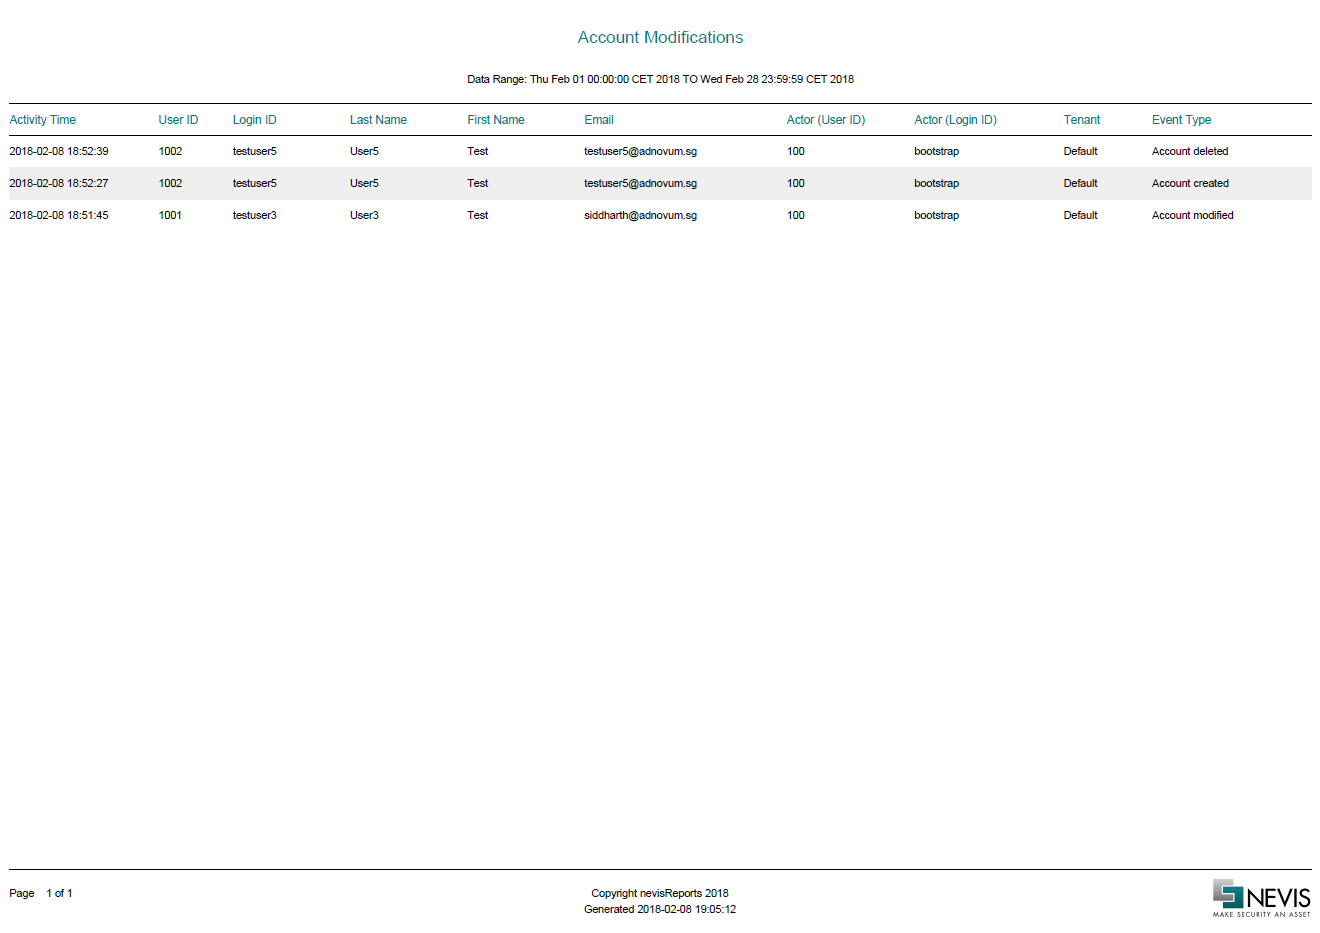
Account Modifications report
The Account Modifications report shows details about user account activities like the creation, deletion or update of a nevisIDM account.
This report is based on nevisIDM event log data.
This report may help you answer the following questions:
- Which accounts have been recently created, deleted or archived?
- Which users have recently updated the personal details of their accounts? As a prerequisite for this report, you need nevisIDM version 2.65 or higher.
Filters
The Account Modifications report offers the following filter options:
Date Period: With this filter, you can set the reported time period. It is possible to show traffic for the current month, the previous month, or a custom date range. In case of the custom date range,
Tenant: Use this filter to limit the returned data to a single tenant. The report does not include subjects who do not belong to this tenant. Default is All tenants.
Login ID: Use this filter to limit the returned data to the subject's login ID on whose account the modification was made. Default is All login IDs.
Data description
The report contains the following columns:
| Column name | Example value | Description |
|---|---|---|
| Activity Time | 2016-01-05 15:01:47 | The timestamp of this user account activity. |
| User ID | 1026 | Corresponds to the user ID in nevisIDM of the user whose account has been updated. |
| Login ID | marcel | Corresponds to the login ID in nevisIDM of the user whose account has been updated. |
| Last Name | Yorker | Corresponds to the last name in nevisIDM of the user whose account was updated. |
| First Name | Marcel | Corresponds to the first name in nevisIDM of the user whose account was updated. |
| [email protected] | Corresponds to the email address in nevisIDM of the user whose account was updated. | |
| Actor (User ID) | 1780 | Corresponds to the user ID in nevisIDM of the actor who made the update. |
| Actor (Login ID) | testadmin | Corresponds to the login ID in nevisIDM of the actor who made the update. |
| Tenant | Default | Corresponds to the tenant in nevisIDM of the user whose account was updated. |
| Event Type | Account created | Corresponds to the type of event that occured to the user account. The following kinds of events are possible : Account created, Account modified, Account deleted |
Sample
The following screenshot shows the first page of the report for a sample data set.
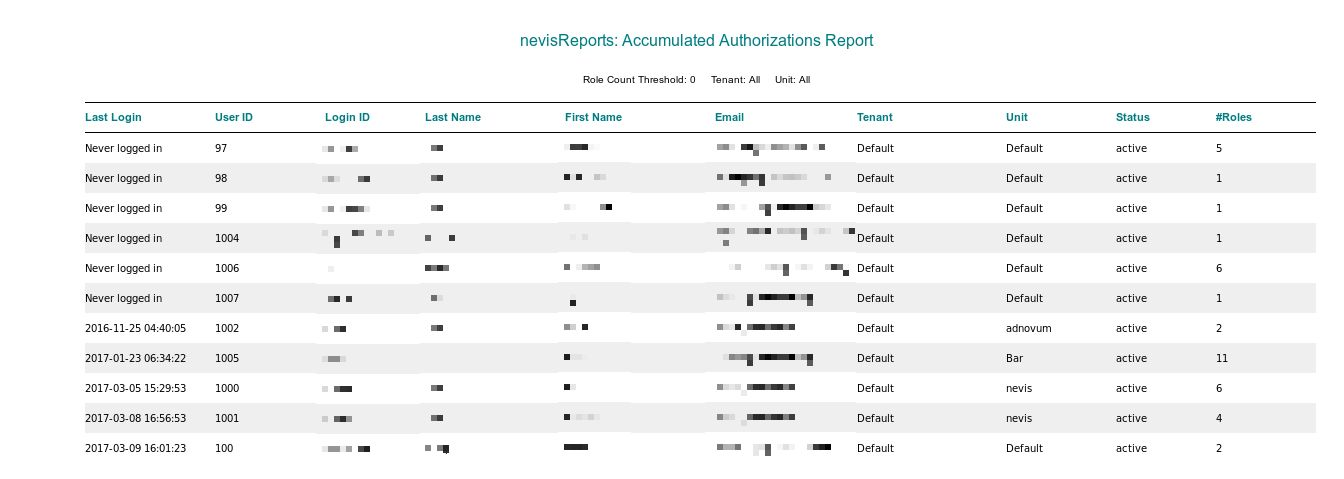
Accumulated Authorizations report
The Accumulated Authorizations report shows a list of users who hold too many roles - through either standard or enterprise role authorization. The report includes all users with an accumulated total number of roles greater than a previously defined threshold. The default threshold value is configurable by Nevis integrators. nevisReports users can adjust the value in the user interface. To configure the default threshold value of the "Role Count Threshold", see Configuring JasperReports Server.
This report is based on data from the nevisIDM database.
This report may help you answer the following questions:
- Are we letting people accumulate too many roles as they go through job rotations or otherwise move around in the organization?
- Do we properly revoke old authorizations after major re-organizations?
Filters
The Accumulated Authorizations report offers the following filter options:
- Role Count Threshold:Use this filter to set the role count threshold. The report will only include users who possess a total number of roles above this threshold.
- Tenant:Use this filter to limit the returned data to a single tenant. The report does not include users who do not belong to this tenant. Choose All to include all tenants.
- Unit: Use this filter to limit the returned data to a single unit. The report does not include users who do not belong to this unit. The default is All units.
Data description
The report contains the following columns:
| Column name | Example value | Description |
|---|---|---|
| Last Login | 2016-01-05 15:01:47 | The timestamp of the last successful login of this user. |
| User ID | 1022 | Corresponds to the user's user ID in nevisIDM. |
| Login ID | nghia | Corresponds to the user's login ID in nevisIDM. |
| Last Name | Nghia | Corresponds to the user's last name in nevisIDM. |
| First Name | Nguyen | Corresponds to the user's first name in nevisIDM. |
| [email protected] | Corresponds to the user's e-mail address in nevisIDM. | |
| Tenant | Default | Corresponds to the nevisIDM client (tenant) the user belongs to. If there is only one tenant, its value is Default. |
| Unit | Marketing | Corresponds to the nevisIDM unit this user's default profile belongs to. |
| Status | active | Corresponds to the user's status in nevisIDM. |
| #Roles | 30 | Shows the number of roles that this user holds. This includes roles authorized via either standard or enterprise role authorization. |
| Role Names | nevisIDM.Root, nevisIDM.UserAdmin, MyApp1.Admin | A comma separated list of all the role names.This column is available only in the csv export. |
Sample
The following screenshot shows the Accumulated Authorizations report based on a sample data set.
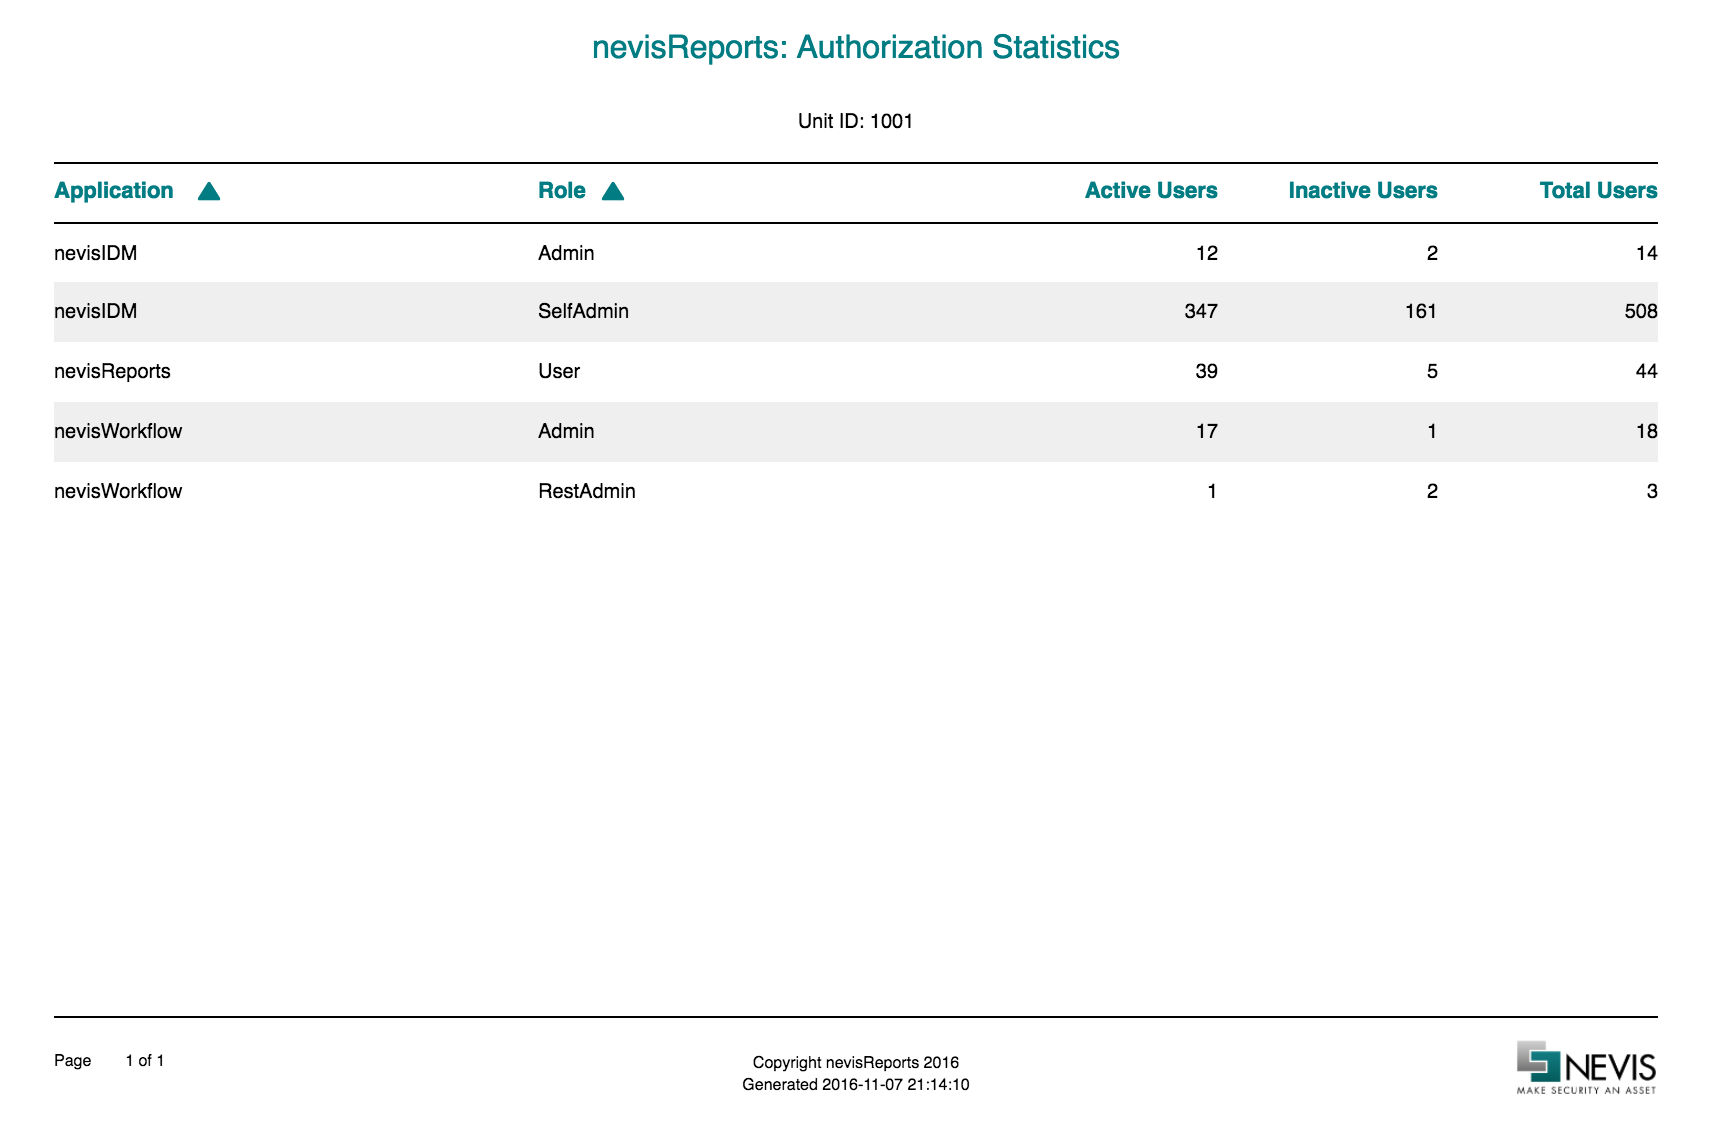
Authorization Statistics report
For a certain specified unit or for all units together, the Authorization Statistics report shows
- each application role that is granted to at least one user, and
- the number of users per role (permission).
The report is based on data from the nevisIDM database.
This report may help you answer the following questions:
- Do the users of a given unit have the expected application roles, or are there users with unexpected authorizations on the list? For example, some companies do not find it desirable that HR application authorizations are granted to users in the Marketing unit.
- Across all units, is there an unexpectedly high amount of users with administrator authorizations? For example, some companies tolerate just a handful of administrators per e-mail application.
See the nevisIDM administration interface if you need further details, e.g., the exact names of users that have a given role.
Filters
The Authorization Statistics report offers the following filter options:
- Unit: By default, the report shows authorizations for all users. With the Unit filter, it is possible to display only authorizations for users that belong to the selected nevisIDM unit.
Data description
The report contains the following columns:
| Column name | Example value | Description |
|---|---|---|
| Application | demobank | the name of the application in nevisIDM |
| Role | customer | the role name in nevisIDM |
| Active Users | 4 | the number of active user accounts that have the role assigned |
| Inactive Users | 1 | the number of locked user accounts that have the role assigned |
| Total Users | 5 | the total number of user accounts that have the role assigned |
Sample
The following screenshot shows the first page of the report for a sample data set.
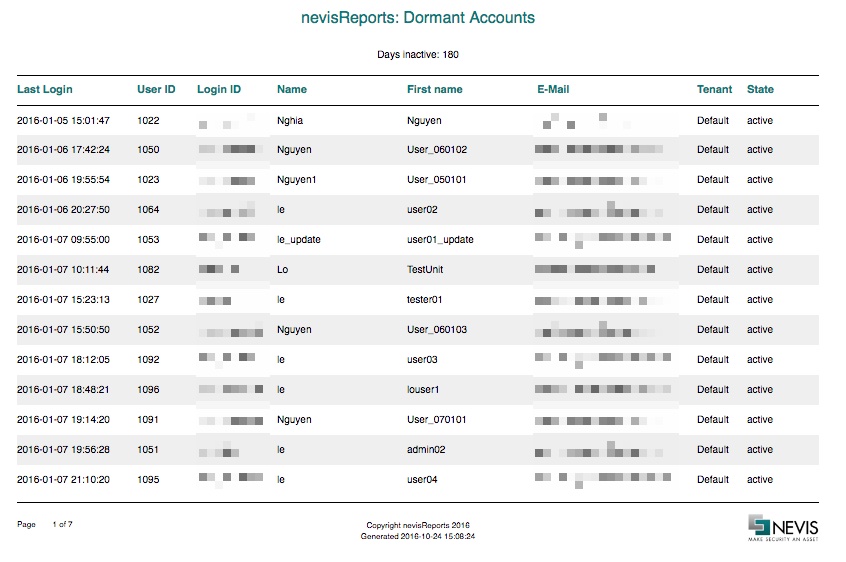
Dormant Accounts report
The Dormant Accounts report shows all active accounts without a successful login during the last 180 days. To configure this default value, see Configuring JasperReports Server.
This report is based on nevisIDM data and requires direct access to the nevisIDM database.
This report may help you answer the following questions:
- Which accounts have not been used for a long time and could be deactivated to reduce our attack surface?
- When was the last successful login of a certain user?
Data description
The report contains the following columns:
| Column name | Example value | Description |
|---|---|---|
| Last Login | 2016-01-05 15:01:47 | the timestamp of the last successful login of this account |
| User ID | 1022 | corresponds to the nevisIDM user ID |
| Login ID | nghia | corresponds to the nevisIDM login ID |
| Name | Nghia | corresponds to the nevisIDM last name |
| First name | Nguyen | corresponds to the nevisIDM first name |
| [email protected] | corresponds to the nevisIDM email attribute | |
| Tenant | Default | the nevisIDM client (tenant)If there is only one tenant, its value is Default. |
| State | active | corresponds to the nevisIDM user status |
Sample
The following screenshot shows the first page of the report for a sample data set.
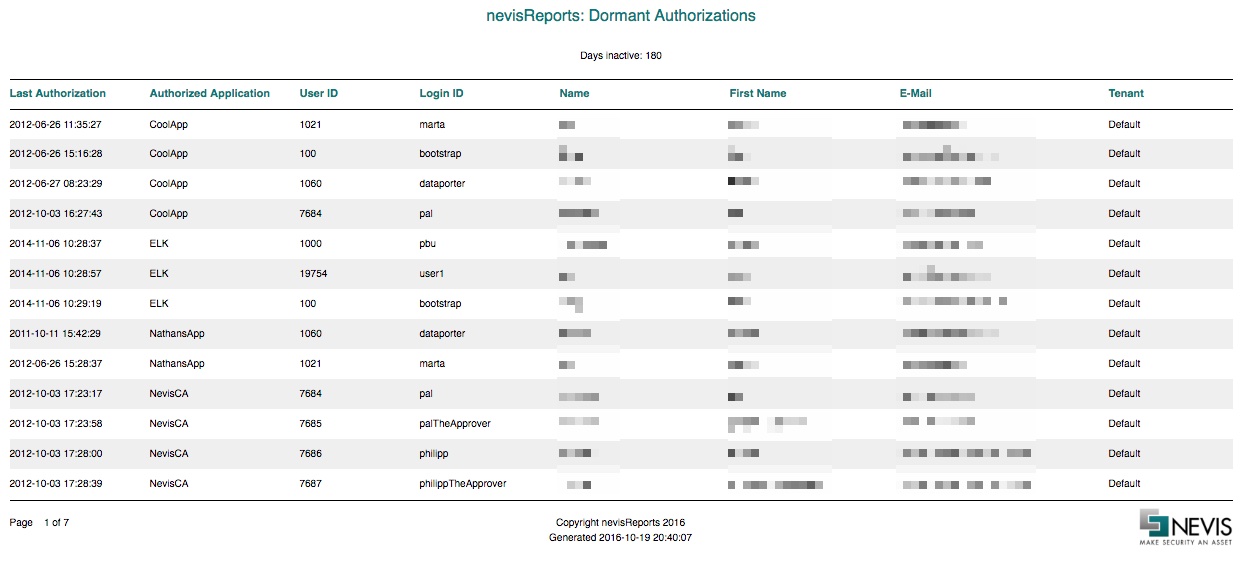
Dormant Authorizations report
Deprecated functionality
The Dormant Authorizations report is deprecated and removed from the Nevis cluster release of November 2019 onwards. The report is based on data produced by the stats component, which is deprecated.
As an alternative, consider using the [Dormant Accounts report].
The Dormant Authorizations report is similar to the [Dormant Accounts report].
This report makes use of snapshot data updated every night from nevisIDM and has been combined with request events from nevisProxy.
This report may help you answer the following questions:
Which account has an active authorization for an application but did not access it recently?
Which authorization could we revert from users to reduce our attack surface? Take note of the following limitations of this report:
The application name mapping configuration needs to be correct. For configuration instructions and best practices, see Custom Logstash mapping configuration.
A user's application authorization is considered to be non-dormant only if the nevisProxy event logs report successful access events to the application by said user. This means that if you use nevisIDM to manage authorizations for applications that are not accessed via nevisProxy (for example, in federated setups), such authorizations may be incorrectly reported as dormant.
This report shows only application-level authorizations and not the specific nevisIDM roles. But by looking up a specific user ID in nevisIDM directly, it is possible to figure out the roles.
Data description
The report contains the following columns:
| Column name | Example value | Description |
|---|---|---|
| Last Authorization | 2012-06-26 11:35:27 | Date and time of the last successful access to the application |
| Authorized application | NevisCA | Name of the application, based on the servlet name and nevisAuth mappings |
| User ID | 1021 | Corresponds to the nevisIDM user ID |
| Login ID | nghia | Corresponds to the nevisIDM login ID |
| Name | Nghia | Corresponds to the nevisIDM last name |
| First name | Nguyen | Corresponds to the nevisIDM first name |
| [email protected] | Corresponds to the nevisIDM email | |
| Tenant | Default | Corresponds to the nevisIDM client (tenant) name |
Sample
The following screenshot shows the first page of the report for a sample data set.
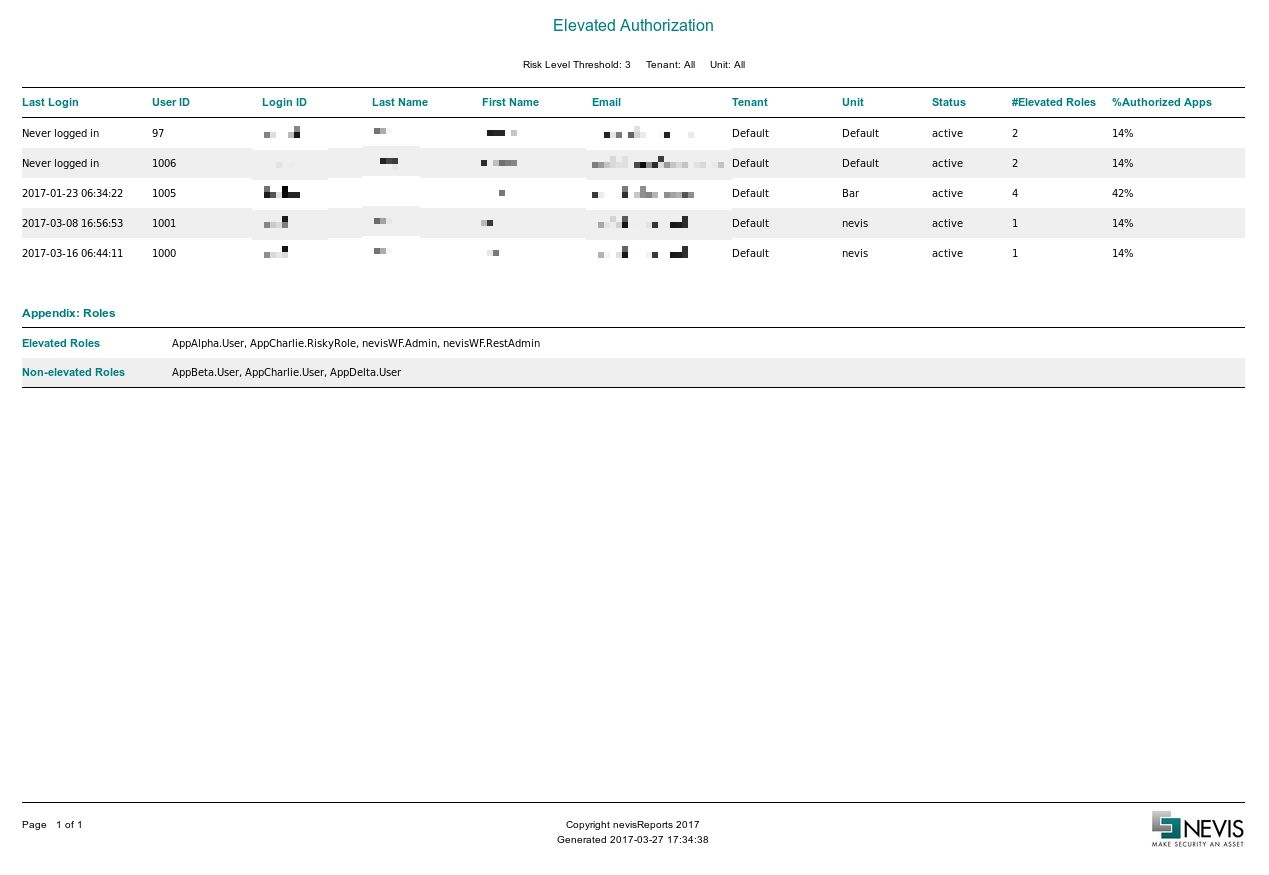
Elevated Authorizations report
The Elevated Authorizations report shows a list of users who possess at least one privileged authorization (e.g., administration role) – through either standard or enterprise role authorization. The system considers a role as privileged or elevated when the role's risk level lies above a threshold value. Both risk level and threshold have integer values. If a role includes rights to modify application settings and parameters, the role may pose a risk: the user that holds the role may change the settings incorrectly. The more rights come with a role, the more risky the role is.
The Elevated Authorization report is based on the nevisIDM database. It requires the [configuration of a RiskLevel property in nevisIDM] to work.
This report may help you answer the following questions:
- Which users represent the biggest risk factor?
- Which users may no longer need certain administrator rights?
Filters
The Elevated Authorizations report offers the following filter options:
- Risk Level Threshold:Use this filter to set the risk level threshold. The report will only include users with roles that have risk levels above this threshold. Only these roles are considered as privileged/elevated.
- Tenant: Use this filter to limit the returned data to a single tenant. The report does not include users who do not belong to this tenant. Default is All tenants.
- Unit: Use this filter to limit the returned data to a single unit. The report does not include users who do not belong to this unit. Default is All units.
Data description
The report contains the following columns:
| Column name | Example value | Description |
|---|---|---|
| Last Login | 2016-01-05 15:01:47 | The timestamp of the last successful login of this user. |
| User ID | 1022 | Corresponds to the user's user ID in nevisIDM. |
| Login ID | nghia | Corresponds to the user's login ID in nevisIDM. |
| Last Name | Nghia | Corresponds to the user's last name in nevisIDM. |
| First Name | Nguyen | Corresponds to the user's first name in nevisIDM. |
| [email protected] | Corresponds to the user's e-mail address in nevisIDM. | |
| Tenant | Default | Corresponds to the nevisIDM client (tenant) the user belongs to.If there is only one tenant, its value is Default. |
| Unit | Marketing | Corresponds to the nevisIDM unit this user's default profile belongs to. |
| Status | active | Corresponds to the user's status in nevisIDM. |
| #Elevated Roles | 3 | Shows the number of elevated roles that this user holds. This includes roles authorized via either standard or enterprise role authorization. |
| %Authorized Apps | 25% | Shows the percentage of applications to which this user has an elevated authorization. |
| Elevated Roles | nevisIDM.Root, nevisIDM.UserAdmin, MyApp1.Admin | A comma separated list of all the elevated role names.This column is available only in the csv export. |
Appendix: Roles Legend
A legend listing all the elevated and non-elevated roles that are used to generate the report is attached in the report footer.
Elevated roles: nevisIDM.Root, nevisIDM.UserAdmin, ..., MyApp1.admin, MyApp2.admin, ...
Non-Elevated roles: nevisIDM.SelfAdmin,..., MyApp1.User, MyApp2.User, ...
Sample
The following screenshot shows the first page of the Elevated Authorizations report based on a sample data set.
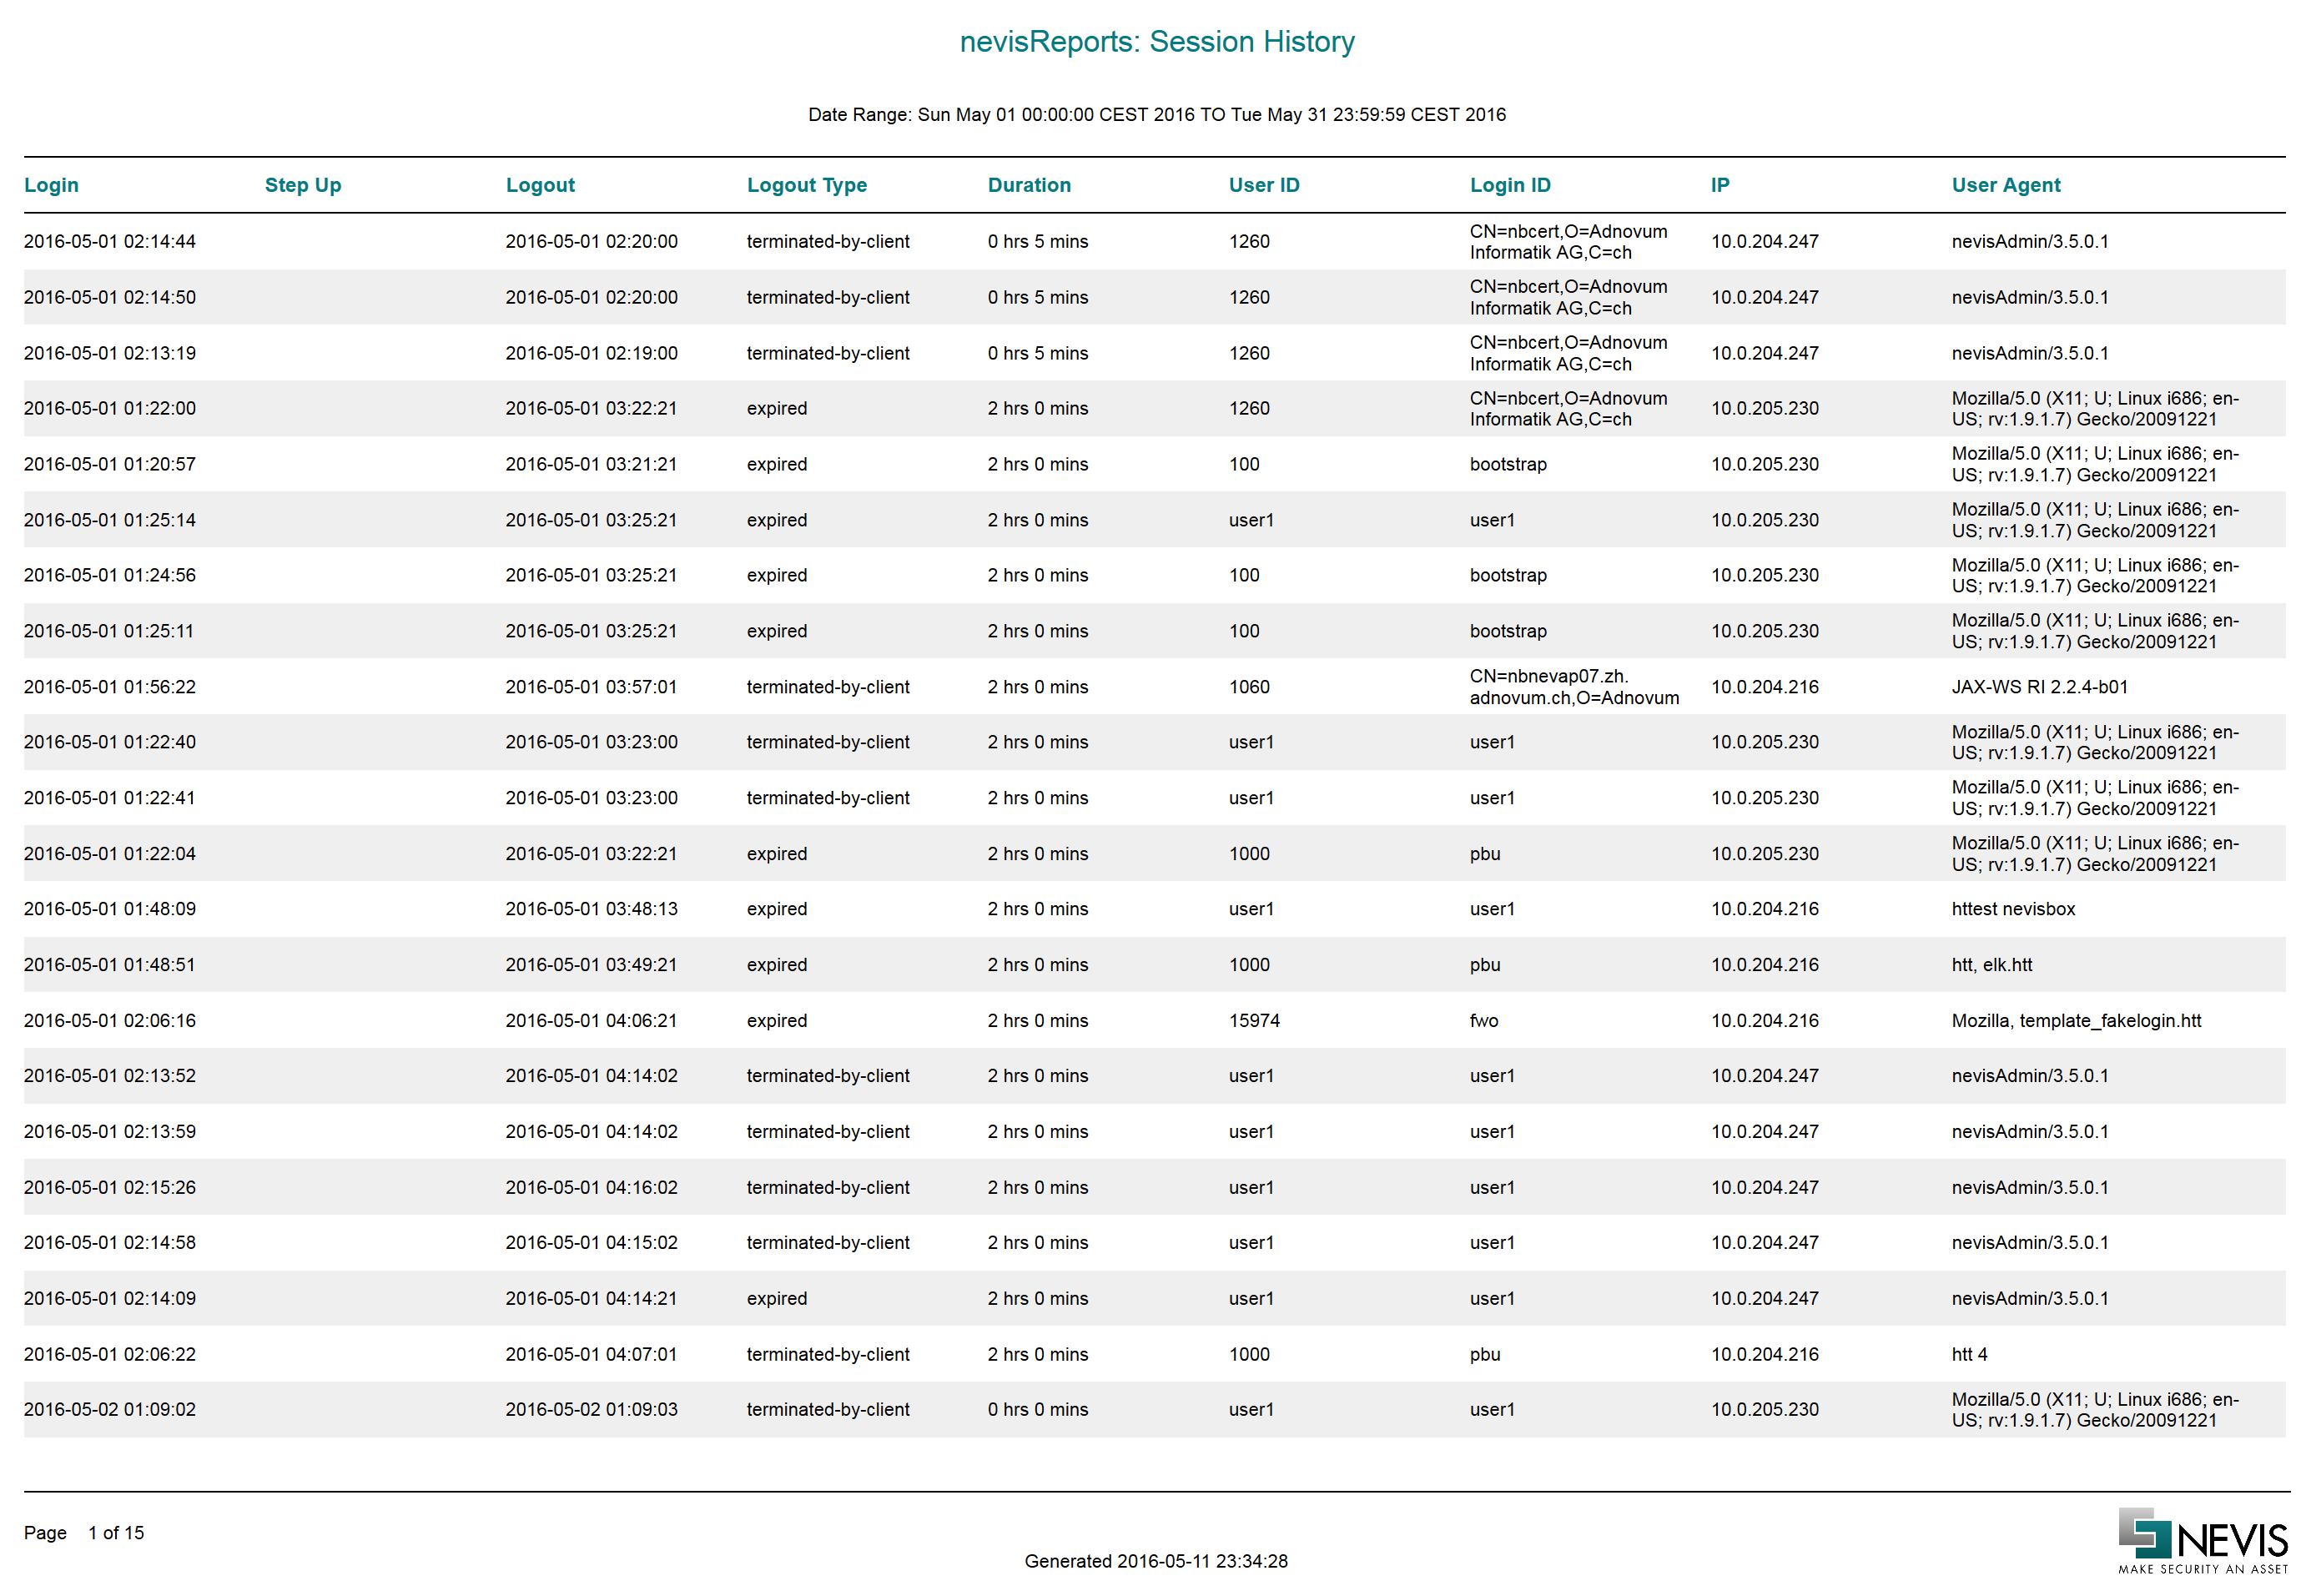
Session History report
The Session History report lists user sessions that were started or completed during a given time frame. Only authenticated sessions to protected resources are shown in the report.
The report is based on nevisAuth event log data.
This report may help you answer the following questions:
- At which times did a particular user use the system, for how long, and with which client?
- Why did a particular session end?
Filters
The Session History report offers the following filter options:
- Date Period: With this filter, you can set the reported time period. It is possible to show sessions for the current month, the previous month, or a custom date range. In case of the custom date range,
Data description
The report contains the following columns:
| Column name | Example value | Description |
|---|---|---|
| Login | 2016-01-14 00:33:01 | Date and time the user logged in (session start). |
| Step Up | Date and time the user entered additional credentials to increase or re-certify the authentication level. This event occurs only in certain configurations. | |
| Logout | 2016-01-14 02:33:20 | Date and time the session ended (e.g., the user logged out or the session timed out). |
| Logout Type | expired | Reason for the session ending. In the case of expired, the session timed out. For further possible values, see chapter AuthEvent, subchapter "List of session end reasons", in the nevisReports Developer Guide. |
| Duration | 2 hrs 0 mins | The length of the session. |
| User ID | 23492 | The user name (principal name) provided by the back-end authentication system after successful login. Application back-end systems usually use this value to identify the user. |
| Login ID | nevisdp | The user name as entered by the user during the login process. In some cases, it is different from the user ID above. |
| IP | 10.0.205.230 | The IP address of the client from which the user logged in. In some cases, this can be the IP address of a forward proxy. |
| User Agent | Mozilla/5.0 (X11; U; Linux i686; en-US; rv:1.9.1.7) Gecko/20091221 Firefox/3.5.7 | The user agent (web browser identification string) of the client. |
Sample
The following screenshot shows the first page of the report for a sample data set.
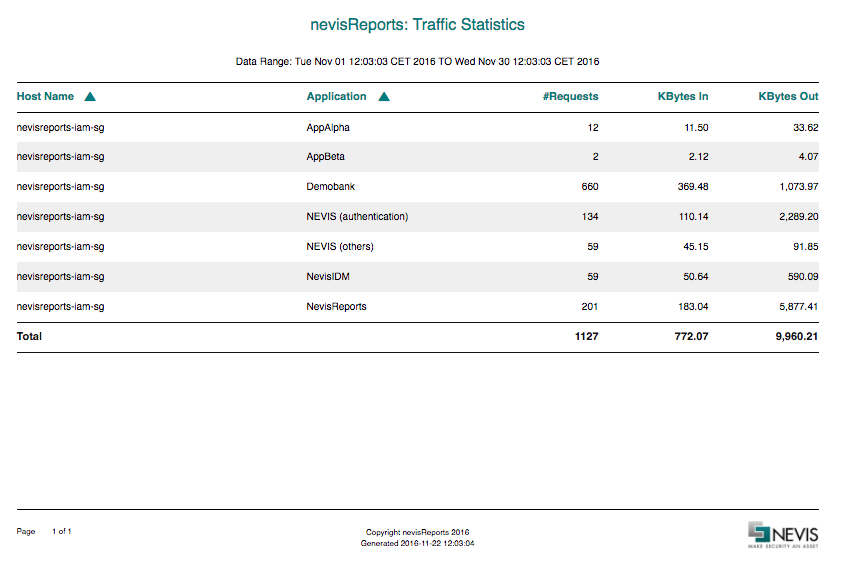
Traffic Statistics report
The Traffic Statistics report shows the number of HTTP requests as well as the amount of data (bandwidth) consumed by these requests, per application. The report does not include applications that have not been accessed.
This report is based on nevisProxy event log data.
This report may help you answer the following questions:
- Which applications consume the majority of network bandwidth?
- Which applications are actively used during a given time period?
Filters
The Traffic Statistics report offers the following filter options:
- Date Period: With this filter, you can set the reported time period. It is possible to show traffic for the current month, the previous month, or a custom date range. In case of the custom date range,
Data description
The report contains the following columns:
| Column name | Example value | Description |
|---|---|---|
| Host Name | nbnevap07 | The requested front-end (browser-visible) host name. |
| Application | demobank | The mapped back-end application. |
| #Requests | 1591 | Number of HTTP requests that were processed for the given application. |
| KBytes In | 1,663.31 | Amount of data transferred from the client (browser) to nevisProxy. |
| KBytes Out | 5,304.09 | Amount of data transferred from nevisProxy back to the client (browser). |
The sample values above refer to an application with the following base URL: "https://nbnevap07/demobank/".
Sample
The following screenshot shows the first page of the report for a sample data set.
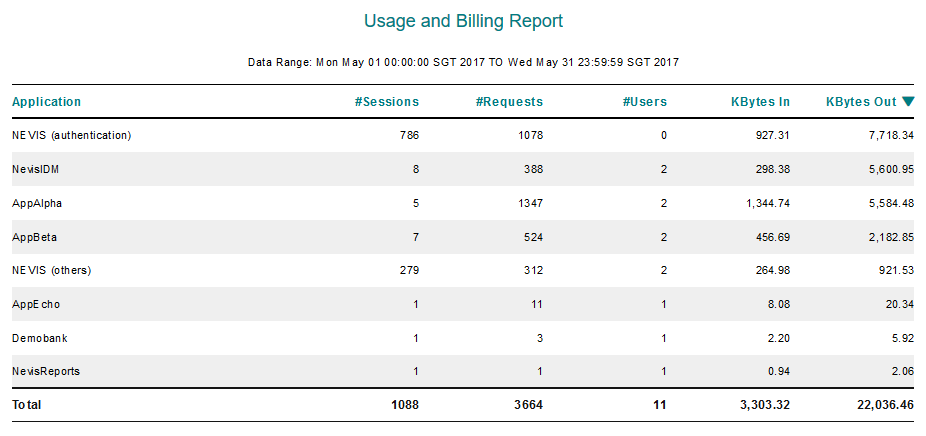
Usage and Billing report
The Usage and Billing report shows the consumption of the Nevis infrastructure and applications protected by Nevis.
The consumption is measured by a variety of metrics, such as the amount of data transferred, the total number of unique users, etc. The data can be grouped into in
The Usage and Billing report may help you answer the following questions:
- How much bandwidth is consumed by a specific application?
- How many requests and sessions have been started by a specific user over a given period of time? By default, this report only displays usage data without any billing calculations. The raw usage data is intended to be exported as a CSV file and imported into another system (e.g., an ERP or excel spreadsheet). However, it is possible to execute billing calculations without any external system. For this, Nevis integrators implement a pricing model of the customer's choice. nevisReports ships with a complete example, so it is easy to make such a customization.
The Usage and Billing report is based on nevisProxy event log data. To use the billing, a script must be written and configured. See Configuring billing calculation for Usage and Billing report for more details.
By default, this report can generate a bill for a maximum of 50 nevisProxy instances. The report is not configurable.
Parameters
The Usage and Billing report accepts the following input parameters from users:
Date Period: This parameter defines the reported time period. It is possible to show usage data for the current month, the previous month, or a custom date range. In case of the custom date range,
Itemize By:This parameter defines how the usage data is grouped in the report. The following item types are available: "Proxy Servers", "Application Servers", "Applications" or "No Itemization". E.g., if you select the line item type "Applications", the bandwidth usage is grouped per application. Each line in the report represents an application (see the samples further below).
Data description
The report contains the following columns:
| Column name | Example value | Description |
|---|---|---|
| Application Server / Proxy Server / Application | demobank /nbnevap07.zh.adnovum.ch | The mapped back-end application (server) or the proxy server. The report parameter Itemize By determines which value is displayed in this column. If "No itemization" is chosen, this column will be omitted. The table then contains only one row. |
| #Sessions | 123 | Number of unique sessions that were used to access the given application/application server/proxy server. |
| #Requests | 1591 | Number of HTTP requests that were processed for the given application/application server/proxy server. |
| #Users | 28 | Number of unique users that accessed the given application/application server/proxy server. |
| KBytes In | 1,663.31 | Amount of data transferred from the client (browser) to nevisProxy. |
| KBytes Out | 5,304.09 | Amount of data transferred from nevisProxy back to the client (browser). |
| Amount | $182.56 | Billable amount calculated based on the selected pricing formula. |
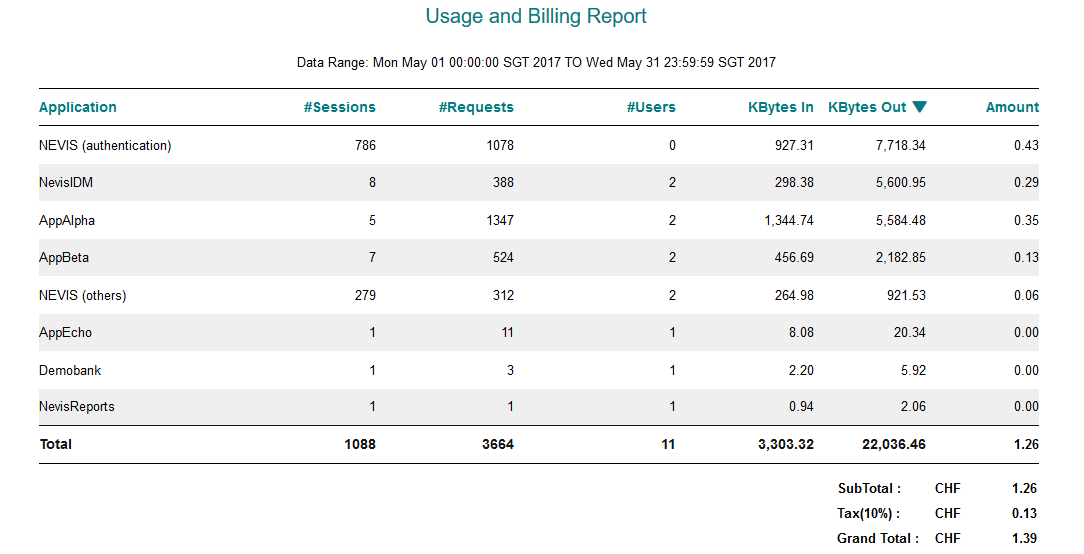
Sample
The following screenshots show the Usage and Billing report based on a sample data set.
1 - No pricing (default)
2 - With pricing activated
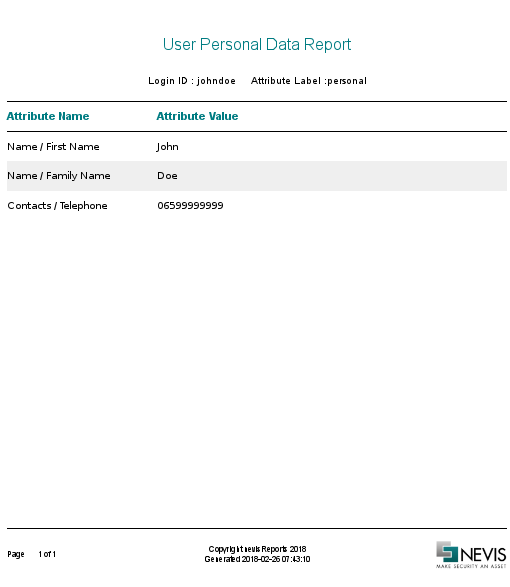
User Personal Data report
The User Personal Data report displays all data of a specific user that is labelled ("tagged") with the Information Classification tag in nevisIDM.
This report is based on the nevisIDM Query Service and User Service REST APIs. The chapter Configuring nevisIDM REST API access describes the configuration needed to access the nevisIDM REST API from nevisReports.
This report may help you answer the following question(s):
- What personal data (per user) is stored in nevisIDM?
The report could be used to become compliant with various Data Protection Laws (like GDPR).
- As a prerequisite for this report, you need nevisIDM version 2.66 or higher.
- See the nevisIDM reference guide for information on how to configure the Information Classification tag. Filters
The User Personal Data report offers the following filter options. They are all mandatory. That is, you need to specify all filters (fields) to get a valid result.
- Tenant: The tenant to which the user belongs.
- Login ID: The login ID of the user.
- Attribute Label: Name of the attribute label that is tagged to the user's data in nevisIDM (e.g., "personal").
Data description
The data in this report is represented in "key, value" format, where
- key is the attribute name (like "First Name") labelled with a specific attribute label (like "personal").
- value is the corresponding value of the attribute (like "John") in nevisIDM.
The number of labelled attributes in nevisIDM can vary. As a consequence, the number of rows shown in the report will also vary, according to the number of attributes labelled with the specific attribute label. For example, four attributes are labelled with the attribute label "sensitive", whereas ten attributes are labelled with the attribute label "personal". If you run the report with the attribute label "sensitive" as input data, the report will contain four rows (one row per "sensitive" attribute"). If you run the report with the "personal" attribute label as input, the report includes ten rows.
Sample
The following screenshot shows the first page of the report for a sample data set.
ACAA Overview report
Deprecated functionality
The ACAA Overview report is deprecated and will be removed in the Nevis cluster release of November 2019 onwards. It was based on the ACAA plug-in of nevisAuth, which is not available anymore.
Beta: This is a preview feature that works with the Adaptive Context Authentication plugin for nevisAuth. Features documented here might change in later releases of nevisReports.
The Adaptive Context-Aware Authentication (ACAA) Overview report shows context-aware authentication details of user logins. The report is based on data delivered by the ACAA plug-in of nevisAuth. Among others, the report shows the risk score distribution over a specified period of time. It also depicts from which countries users have logged in and how often, as well as the login times. This allows detecting anomalies and irregularities at a glance.
The Adaptive Context-Aware Authentication (ACAA) plug-in of nevisAuth uses behavioral context data to decide how to authenticate a user during login. For every login, the plug-in compares the context data of the user's current login with this user's login profile. Based on this comparison, the plug-in calculates the risk of the current login.
The implementation of the plug-in is based on context modules. The ACAA Overview report shows the performance of these modules. The report includes detailed information about the following modules:
- The Device Recognition module. This module screens the user's login in regard to the user's device. The device is identified by a browser cookie.
- The Geolocation module. This module screens the user's login in regard to the client IP address. It checks whether the user logs in from a suspicious country.
- The Time of Day module. This module screens the user's login in regard to the login time.
The report is based on ACAA event log data. There are two ACAA event types: "risk score" and "persist". The ACAA risk scoreevent captures the risk score evaluation data. The ACAA persist event captures data stored in the long-term data storage.
This report may help you answer the following questions:
- Which ACAA modules are configured and how is their risk score distributed over the number of logins? E.g., the risk score distribution for the Geolocation module may show a very high number of no- to low-risk logins and close-to-zero high-risk logins. This result may trigger you to adapt the risk weight of the Geolocation module in the calculation of a login's overall risk score.
- How many potential threats have been thwarted during login activities? The report visualizes the delta between risk score events and persist events. In the case of high-risk logins, this delta correlates with the number of potential threats.
- From which countries do most of my customers log in? The Countries chart helps to understand which countries could be added to the ACAA settings of trusted and suspicious countries.
For more details about the ACAA plug-in and how to install it, see the separate ACAA User Manual.
The ACAA Overview report requires the ACAA module to be configured and installed in nevisAuth.
Filters
The ACAA Overview report offers the following filter option:
- Date Period: Use this filter to set the reported time period. The report only considers logins during this period of time. It is possible to show sessions for thecurrent month, the previous month, or acustom date range. In case of the custom date range,
Data description
The ACAA Overview report contains multiple charts. This section describes each chart and its fields in detail.
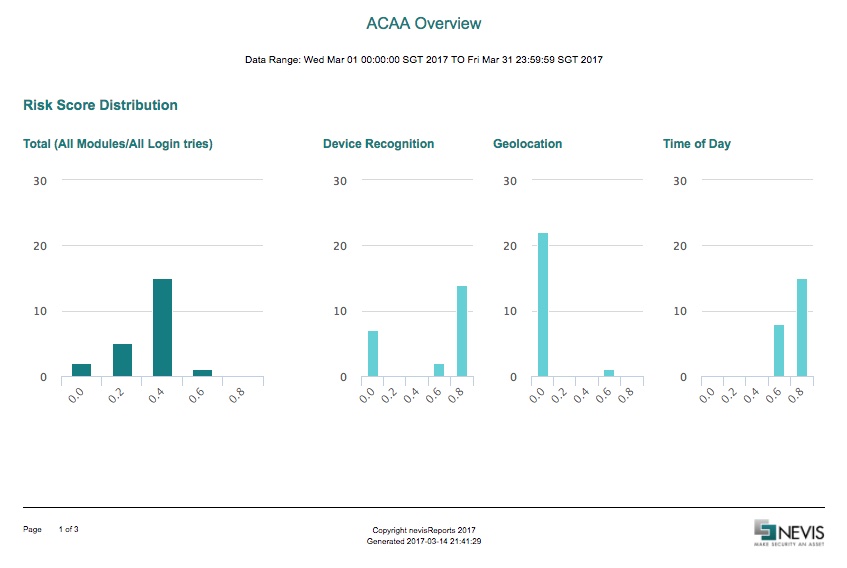
Risk Score Distribution Chart
If all ACAA modules are configured, four different risk score distribution charts are shown. They are all based on logged risk score events.
- Total (all modules / all login tries): This chart shows the distribution of the risk score over all modules and all login tries, for the specified time period.
- Device Recognition: This chart shows the risk score distribution for the Device Recognition module, for the specified period of time.
- Geolocation: This chart shows the risk score distribution for the Geolocation module, for the specified period of time.
- Time of Day: This chart shows the risk score distribution for the Time of Day module, for the specified period of time.
The table below describes the axes of the Risk Score Distribution chart:
| Axis | Label | Description |
|---|---|---|
| X (horizontal) | Risk score | The risk score distribution between 0.0 and 1.0. The definition of low risk / high risk is specified in the ACAA configuration. |
| Y (vertical) | Number of events | The number of risk score events per risk score result. |
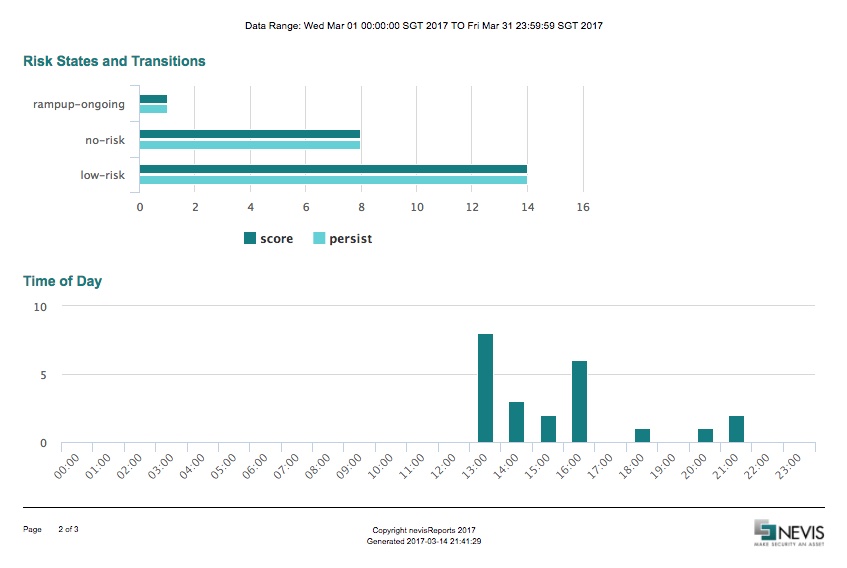
Risk States and Transitions Chart
The ACAA plug-in contains different risk states and transitions based on the calculated risk score and the state of the plug-in.
To avoid an "overreaction" during the initial production phase, the ACAA plug-in starts with a ramp-up phase. During the ramp-up phase, the ACAA plug-in learns about the users' behavior by acquiring context data for a defined number of logins and over a specified time period. The plug-in also evaluates the risk score, but no active enforcement of any transition (like step-up or re-authentication) takes place. During this phase, all information is persisted (stored). If the plug-in has gathered enough information, the ACAA plug-in automatically switches into the enforcement phase. In the enforcement phase, only the successful logins are stored (persisted). Now, the evaluation of the risk score leads to a corresponding transition (that is, the next step in the authentication process). E.g., a high-risk score corresponds with the high-risk transition, which will trigger a step-up or re-authentication.
The Risk States and Transitions chart displays the number of risk score events and persist events per transition. The table below describes the chart rows:
| Row | Bar | Description |
|---|---|---|
| ramp-up-ongoing | score | The number of risk score events during the ramp-up phase. The events can have any kind of risk score. |
| persist | The number of persist events during the ramp-up phase. Usually each risk score event leads to a persist event (unless there is a user abort or client timeout). | |
| no-risklow-risk | score | The number of risk score events (logins) that have been identified as no-risk or low-risk. |
| persist | The number of persist events. Since only the successful logins are stored (persisted), the number of persist events correlates with the number of successful authentications. For login events with a no-risk and low-risk score, the delta between the number of risk score- and persist events is usually low, and represents user aborts or similar occurences. | |
| high-risk | score | The number of login events that have been identified as high risk. |
| persist | The number of persist events for logins identified as high-risk. This number basically equals the number of successful step-ups or re-authentications that followed after a high-risk login event. In the enforcement phase and for high-risk logins, the delta between risk score events and persist events is the number of potentially mitigated threats. |
Time of Day Chart
The Time of Day chart displays the distribution of the logins over the course of the day. This chart shows you when users usually log in. The ACAA plug-in specifies the login time based on either a fixed time zone or the server time zone information. The chart is based on ACAA persist events (successful logins) only.
This chart is available only if the Time of Day module in the ACAA plug-in is enabled.
The table below describes the axes of the Time of Day chart:
| Axis | Label | Description |
|---|---|---|
| X (horizontal) | Number of events | The number of persist events (logins) during that time of day interval (1 hour). |
| Y (vertical) | Time of day | Time range (1 hour), based on a fixed time zone or the server time zone. |
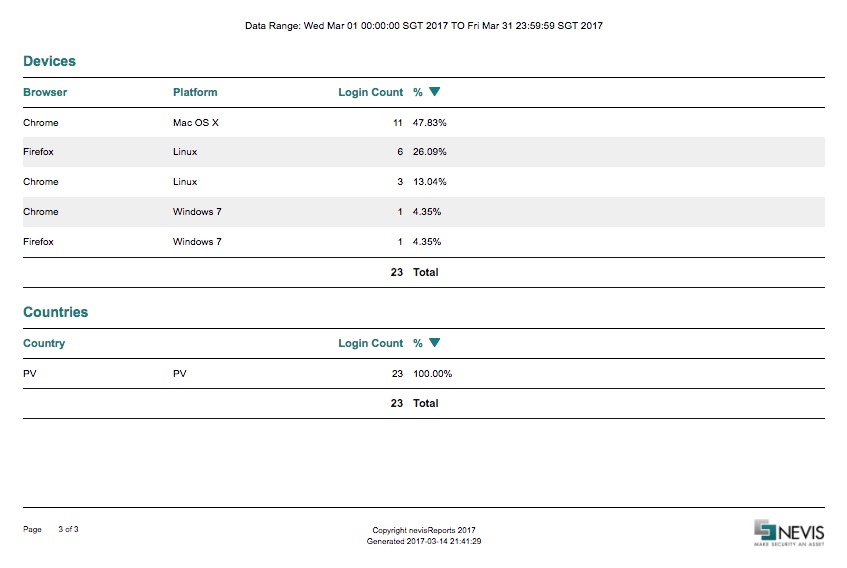
Devices Chart
The Devices chart lists the most common devices and platforms, in order of popularity. The data is based on information from the persisted (successful) logins.
This chart is available only if the Device Recognition module in the ACAA plug-in is enabled.
The table below describes the axes of the Devices chart:
| Column name | Example value | Description |
|---|---|---|
| Browser | Chrome | Name of the browser being used. |
| Platform | MacOS X | The device platform that the browser is running on. |
| Login Count | 34 | Number of persist events (logins) for that browser/platform combination. |
| % | 23% | Percentage compared to the total number of persist events. |
Countries Chart
The Countries chart shows from where users log in (which countries). The plug-in uses an IP-to-country database to determine the country. The input data for the report is based on information from the persisted (successful) logins.
This chart is available only if the Geolocation module in the ACAA plug-in is enabled.
The table below describes the axes of the Countries chart:
| Column name | Example value | Description |
|---|---|---|
| Country (name) | Switzerland | The descriptive name of the country. If no mapping is available, it only shows the two letter ISO code. |
| Country (code) | CH | The ISO two letter country code.If the IP address could not be mapped, the code used is "XX". For private networks, the country code is "PV". |
| Login Count | 53 | Number of persist events (logins) from that country. |
| % | 56% | Percentage compared to the total number of persist events. |
Sample
The following screenshots illustrate the ACAA Overview report.
Nevis Summary Dashboard
Deprecated functionality
The Nevis Summary Dashboard is deprecated and removed from the Nevis cluster release of November 2019 onwards.
If you want to set up a configurable, real-time dashboard, see Monitoring Patterns in the nevisAdmin 4 Technical Documentation. This section explains the configuration of a dashboard with Elastic Stack including Kibana. With Kibana, you can configure flexible visualizations based on most of the data sources that also power the Nevis Summary Dashboard. Available data sources include the nevisProxy, nevisAuth, and nevisIDM event logs, with the exception of nevisIDM snapshot data.
Another alternative may be to feed Nevis log files into an enterprise SIEM solution already available in your organization, and configure a dashboard within that system.
Introduction
The Nevis Summary Dashboard provides near real-time governance dashboards on the usage of all main components of the Nevis Security Suite. It allows the user to identify normal and abnormal behavior, which is crucial in detecting potential problems and threats.
This dashboard may help you answer questions such as the following:
- Is nevisProxy experiencing more concurrent sessions, or is it under higher attack than usual? Unexpected spikes are an indicator for high load or a potential attack or threat.
- How many nevisIDM accounts have not seen any activity lately and how did this change over time? Reduce the risk exposure of your system by monitoring account activity and see changes in dormant accounts.
- Do end users experience stable response times from nevisProxy and from protected applications? Unexpected variations in response time may hint at networking problems or overloaded servers.
- Is there an unexpected increase in the error rate of one of my protected applications? Uncover potential operational issues affecting the business applications protected by nevisProxy.
Anatomy of a chart
Most charts on the dashboard consist of the elements explained below. Some of the charts contain different elements. These are explained in their respective sections.
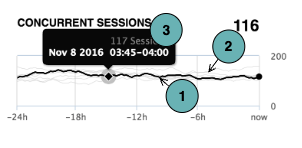
- The black line represents the data points during the chart's period, which can be either the last 24 hours or the last 3 months.
- For 24-hour charts, one data point is displayed for every 15-minute time frame.
- For 3-month charts, one data point is displayed for every day.
- In 24-hour charts only, the grey lines show data points for previous 24-hour periods, e.g., for yesterday, the day before, and so on. For example, if the current data point on the black line selected is November 8, 03:45-04:00, the points directly above and below on the grey lines represent the number of concurrent sessions on the previous seven days at the same time: 03:45-04:00.
- When clicking on a data point, a tooltip with additional information is displayed, including the exact value (e.g., 117 sessions) and the aggregation time period (e.g., November 8, 2016 between 03:45 and 04:00). This means that there have been 117 concurrent sessions between 03:45 and 04:00.
If some intermediate data points are missing for a time period, the line will still be continuous and connect the available data points.
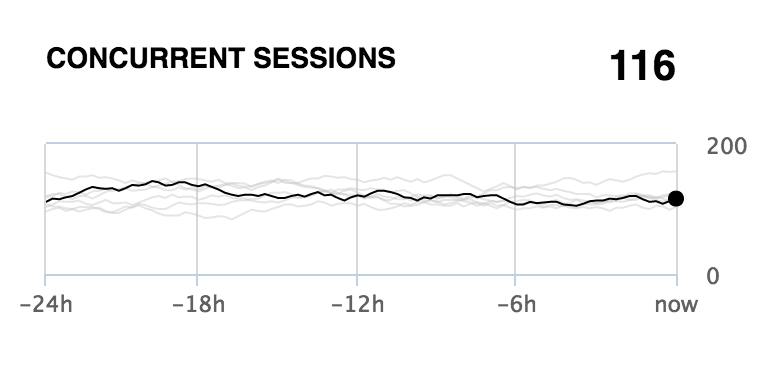
Concurrent sessions
This chart shows how the number of concurrent sessions over the last 24 hours compares to the numbers of concurrent sessions in the past. The black line indicates the activity during the last 24-hour period. The grey lines represent the behavior during previous 24-hour periods. This enables you to recognize normal and abnormal behavior. As long as the black line follows the same pattern as multiple grey lines, you are witnessing normal behavior.
The concurrent sessions chart shows the number of sessions in 15 minute intervals for the last 24 hours. Counted are all unique sessions (logged in or not) to protected resources. Refer to the active sessions chart to see only logged in users.
The chart is based on nevisAuth data.
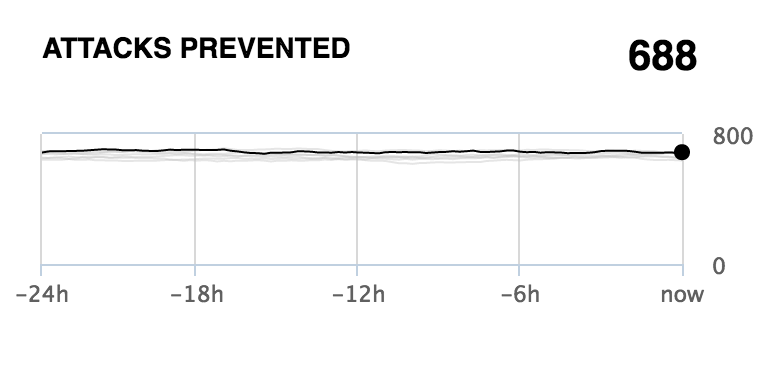
Threats mitigated
This chart represents the number of threats detected by the nevisProxy instances over the last 24 hours compared to the number of threats in previous 24-hour periods. Only threats known by and configured in nevisProxy are detected, e.g., only allowing GET, POST with an InputValidationFilter triggers a mitigated threat event when receiving a PUT request.
The chart is based on nevisProxy data.
Identity and access management
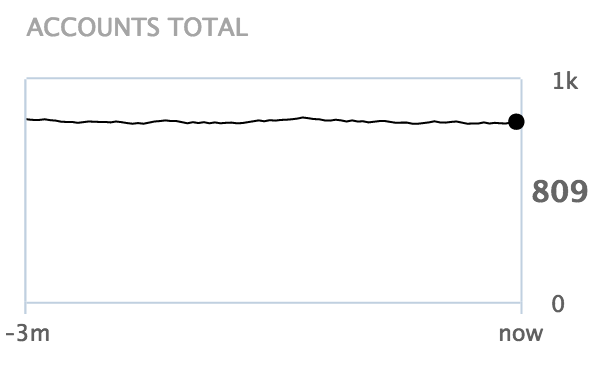
Accounts total
This chart displays the trend of the total number of accounts (also known as identities) in nevisIDM over the last three months.
The chart is based on nevisIDM snapshot data, which is updated once a day.
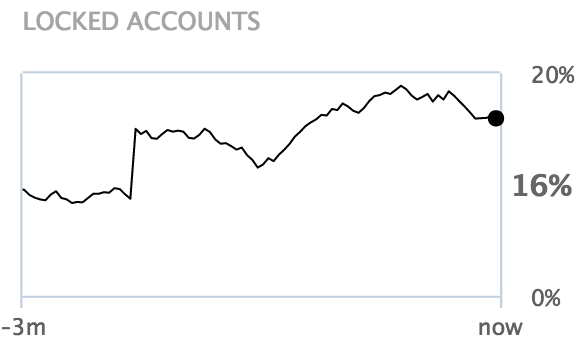
Locked accounts
The locked accounts chart displays how the percentage of locked accounts changed over the last three months. The percentage shown is the ratio of locked accounts to total accounts.
The chart is based on nevisIDM snapshot data, which is updated once a day.
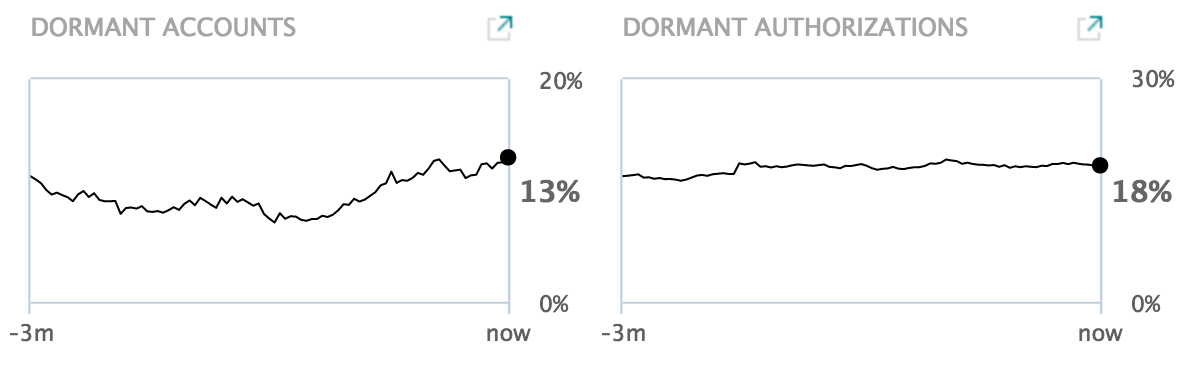
Dormant accounts and authorizations
The dormant accounts chart shows the percentage of enabled accounts that have not been used for 180 days (by default). The chart shows the percentage of each day during the last three months.
Similarly, the dormant authorizations chart shows the percentage of business application authorizations that have not been used for 180 days (by default). nevisReports calculates the percentage as follows:
- For each user that logged in to nevisProxy, count the number of different applications accessed and sum up these values.
- Divide the previous sum by the the total count of different applications authorized per enabled nevisIDM account.
The charts are based on nevisIDM snapshot data, which is updated once a day. Additionally, for the dormant authorizations chart, nevisProxy event logs are consulted to determine which applications have been accessed by the users. Therefore, the latter chart will provide reliable information only when nevisProxy acts as the entry gateway for the applications (also known as a non-federated setup).
Detailed drill-down reports are available here: [Dormant Accounts report].
These reports also show the "Days inactive" setting, i.e., the delay after which an account or application authorization is considered dormant. By default, nevisReports uses a delay of 180 days for dormancy charts and reports, but this system-wide setting may be different for your setup.
Entry gateway
Active sessions (24h)
This chart shows the total number of active sessions per day for each day in the last three months. Only sessions authenticated by nevisAuth are counted. Unauthenticated sessions (e.g., not logged in), sessions authenticated by other authentication providers (e.g ldap) or anonymous requests to unprotected resources (e.g., static files) are not included in the active sessions count.
The chart is based on nevisProxy event log data and aggregated in 24-hour periods.
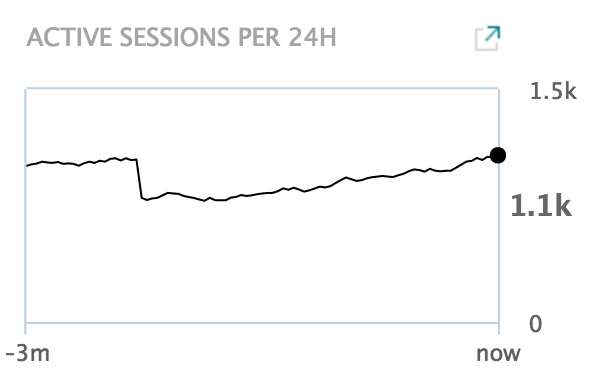
The [Session History report] is a related drill-down report with detailed information (login ID, session duration etc.) for this chart.
Bandwidth
The bandwidth charts show how the total bandwidth consumption changed over the last 24 hours. The grey lines show bandwidth consumed in previous 24-hour periods.
Comparing the top and bottom chart allows you to see the relation between how much data was received (IN) and how much was sent (OUT).
- IN: The upper chart represents the bandwidth sent by clients and received by the nevisProxy. From a client point of view, this is the upload.
- OUT: The bottom chart shows the bandwidth sent by the nevisProxy and received by clients. From a client point of view, this is the download.
The chart is based on nevisProxy event logs.
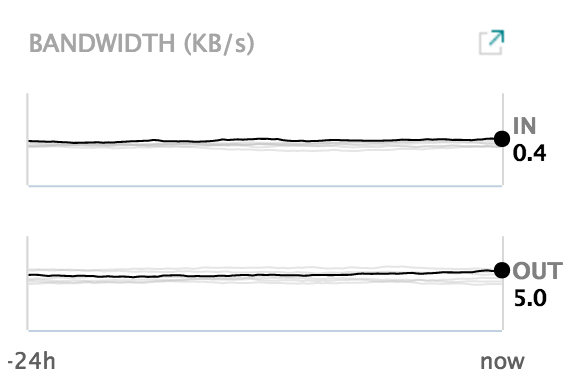
With the [Traffic Statistics report], a detailed traffic and bandwidth report for a custom time period can be created.
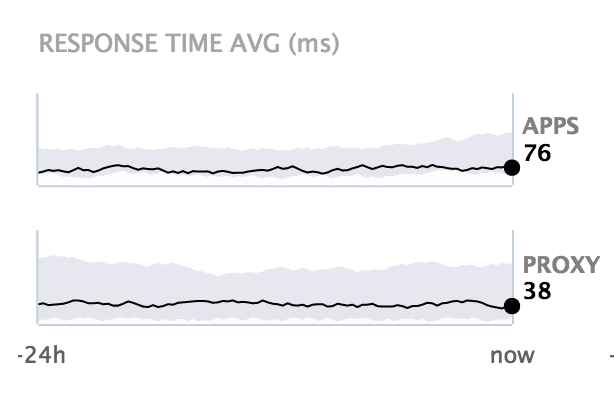
Response time averages
These charts display the response time averages for protected applications and nevisProxy in the last 24 hours. The grey area shows the distribution of 90% of all response times in the last 24 hours. This means that 5% were faster (below the grey area, 5th percentile) and 5% were slower (above the grey area, 95th percentile).
- Apps: The top chart shows the average response times for protected applications measured by nevisProxy.
- Proxy : The bottom chart represents the average response times for nevisProxy itself.
The chart is based on nevisProxy event logs.
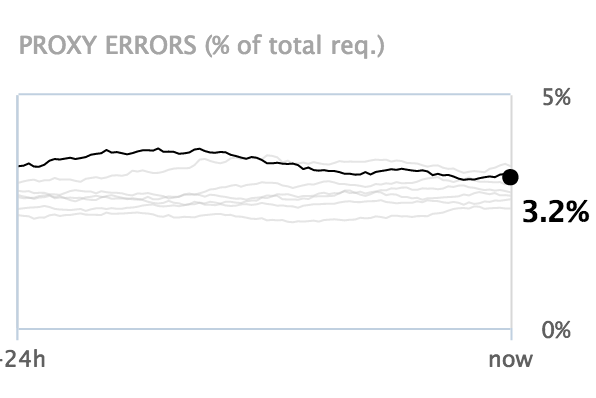
Proxy errors
The proxy error chart shows the error rate of nevisProxy in the last 24 hours. Each grey line shows the error rate for previous 24-hour periods.
The chart is based on nevisProxy event logs.
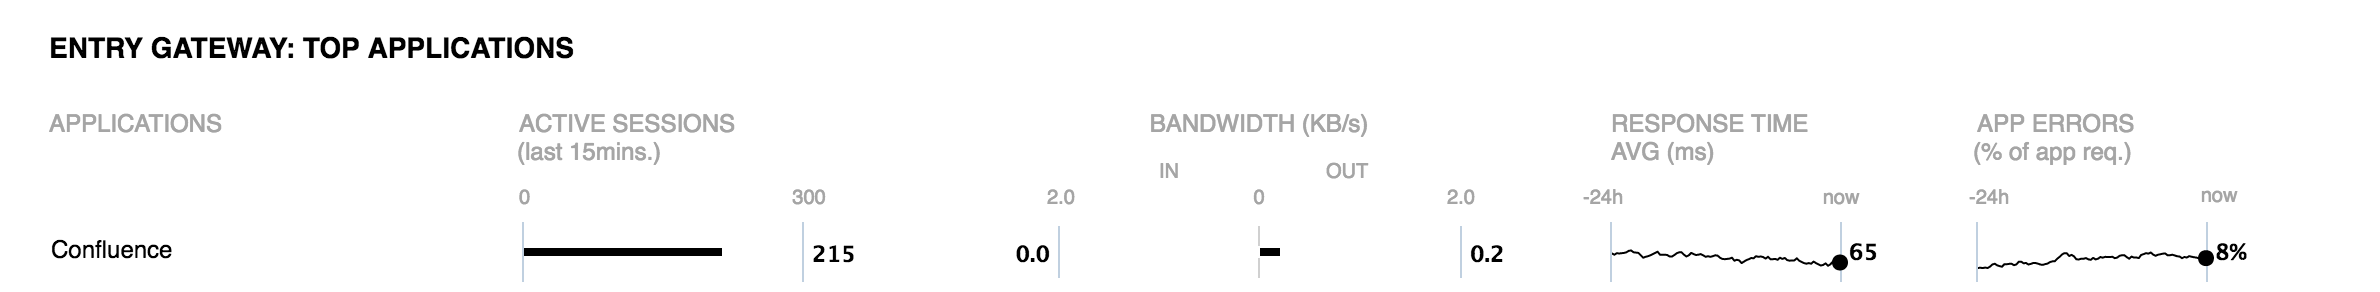
Entry gateway: top applications
The top applications box shows additional measurements for each protected application, sorted by activity in the last 15 minutes. Only applications with an activity in the last 15 minutes are visible.
- Active sessions: Number of authenticated sessions for this application in the last 15 minutes
- Bandwidth: Total bandwidth consumption in the last 15 minutes (left = IN = received by the application, right = OUT = sent by the application)
- Response time average: The average protected application response time over the last 24 hours
- App errors: The error ratio of responses sent by the protected application over the last 24 hours
The charts and numbers are based on nevisProxy event logs.
Known technical limitations
The charts on the Nevis Summary Dashboard will show useful data only if certain conditions are met.
Below is a listing of the Nevis products that your setup needs to contain in order for the charts to work:
- nevisProxy is required for all charts except the accounts total and locked accounts.
- nevisAuth is required for the active sessions charts.
- nevisIDM is required for all charts in the identity and access management box.
Some charts will only work well when Nevis is configured in a particular way. Important requirements are:
- The dormant accounts and authorizations, response time averages (apps subcategory), and top applications charts require that nevisProxy protects all your business applications, i.e., your setup needs to be non-federated.
- The dormant accounts and authorizations chart requires the names used for applications in nevisIDM and nevisProxy configurations to match.
- The app errors charts require that nevisProxy is configured to either pass on application errors to the end user or to log application errors separately.
The Nevis Summary Dashboard summarizes data from all nevisProxy and nevisAuth instances that are configured to feed data into nevisReports. In some companies, nevisProxy or nevisAuth instances perform very distinct functions and mixing data does not make sense. In these cases, we recommend setting up multiple nevisReports appliances or to create a custom dashboard for each functional group of Nevis instances.
Architecture Overview
nevisReports uses various open source components to deliver a powerful reporting system. This section explains which components are used and how they are wired up.
Architecture goals
The goal of the nevisReports system architecture is to fulfill the following requirements:
- Support for the various data sources and data formats used in the components of the Nevis Security Suite.
The default configuration of nevisReports includes the following data sources: nevisProxy event logs, nevisAuth event logs, nevisIDM database, nevisIDM JSON audit logs and nevisIDM REST API. This list will be extended in future versions.
- Storage, search and aggregation of large amounts of log data.
- Report delivery via web, e-mail, and the REST interface in various commonly used document formats such as PDF, Excel and HTML.
- Real-time dashboard delivery via the web interface.
- Extensive customization options of the above aspects. This makes it possible to implement a wide range of customer-specific use cases. See Extension points for more information.
System architecture
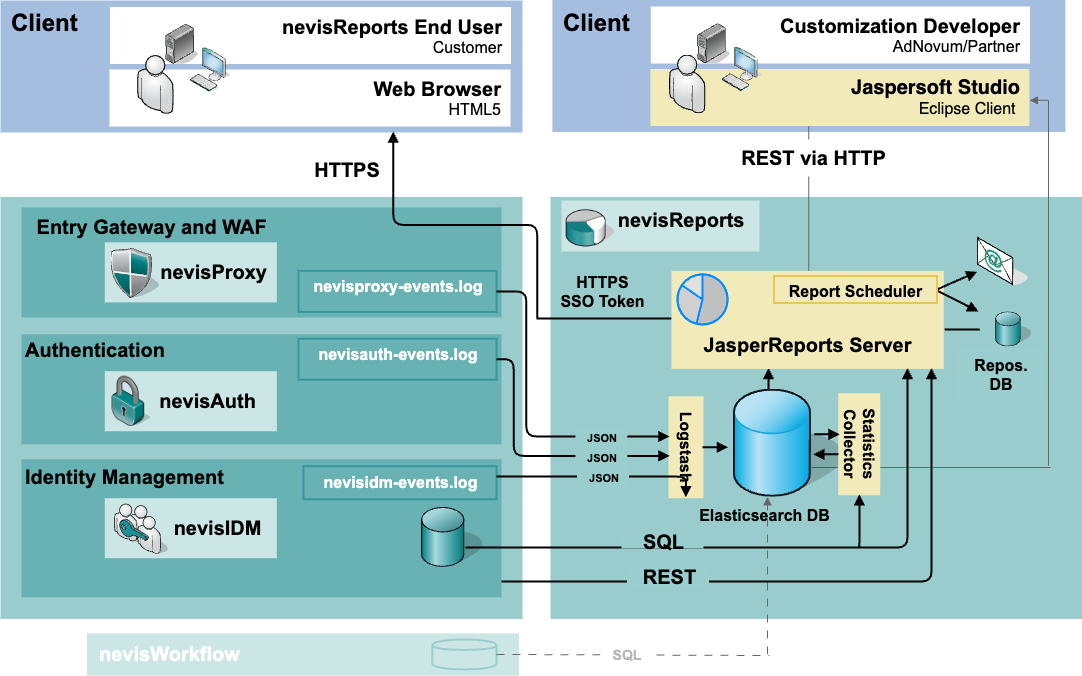
The figure below shows the nevisReports system and the systems surrounding it. The arrows represent the data flow from the source system to the end user.
The system creates reports and dashboards as follows:
- nevisProxy, nevisAuth and nevisIDM log events of interest into the JSON-based nevisproxy-events.log, nevisauth-events.log and nevisidm-events.logfiles respectively, one event per line.
- An event occurs, e.g., whenever an end user accesses a web page protected by Nevis, whenever a user logs in via nevisAuth or when an account is modified in nevisIDM.
- The log lines are locally collected by the Filebeat process and transported to the remote Logstash process, which pre-processes the events.
- When the events have their final form, Logstash stores them in the Elasticsearch database.
- nevisIDM (and nevisWorkflow) store and log data of interest inside their SQL databases.
- The JasperReports Server connects to these databases directly during report generation.
- To avoid load on the nevisIDM database (and the nevisWorkflow database), you can set up a mirror database instance using database-specific tools and configure nevisReports to query from the mirror (slave) instance of the database.
- The statistics collector process, which is also based on Logstash, regularly runs queries against the Elasticsearch and SQL databases. It calculates statistics and summary information from the data provided by the various components.
- For the generation of reports and dashboards, we need to distinguish.
- There are two possible ways to start the generation of a report:
- Real-time: A nevisReports end user accesses the JasperReports Server web application, selects a report definition and runs the report.
- Scheduled: The nevisReports end user schedules a report generation in advance, which also happens via the web application. The report scheduler executes the previously scheduled report, usually repeatedly, at the point(s) in time set by the user. The report is delivered via e-mail or stored in the repository database for later retrieval.
- Dashboards typically present information gathered by the statistics collector in a graphical form. Similar to reports generated in real time, dashboards are provided via the JasperReports Server web application to end users.
- During report and dashboard generation, the JasperReports Server connects to the Elasticsearch database or SQL databases as needed.
- The repository database is used by the JasperReports Server to store all its application data, such as users, report definitions, report schedules and generated reports.
To create custom reports, a customization developer uses the Jaspersoft Studio client application. This application connects directly to a development instance of the JasperReports Server to update report definitions, which are stored in the repository database. To create reports from custom data sources, it is possible to configure the JasperReports Server to connect to custom data sources beyond those provided by the Nevis Security Suite. You can provide these data sources with tools such as nevisDataPorter or Jasper ETL.
This use case may require additional licensing beyond the standard nevisReports license. Contact your Nevis account manager if you plan to configure custom data sources.
Third-party components
The following table lists important third-party components that are included with nevisReports .
| Component | Version | Vendor | Documentation | License |
|---|---|---|---|---|
| Elasticsearch | 6.7.1 | Elastic | Elasticsearch Reference | Open source |
| Logstash | 6.7.1 | Elastic | Logstash Reference | Open source |
| Filebeat | 6.7.1 | Elastic | Filebeat Reference | Open source (Apache v2) |
| JasperReports Server Pro | 7.2.0 | TIBCO | Jaspersoft Documentation | Licensed by Nevis for embedded delivery as part of nevisReports |
| MySQL Server | 5.6.x | Oracle | MySQL Documentation | Open source |
Extension points
By means of well-defined extension points, it is possible to customize the following stages of data collection, report and dashboard generation and end user presentation:
- event logging in nevisProxy, nevisAuth and nevisIDM,
- event processing and statistics query intervals in Logstash,
- event storage in Elasticsearch,
- queries for Elasticsearch and SQL databases,
- dashboard and report generation in the JasperReports Server, and
- theming of the JasperReports Server web application user interface.
Customization developers can leverage the extension points to create custom reports and dashboards from any data source and to freely design the look and feel of report documents. For more information about custom reports, refer to the [nevisReports Developer Guide]. The developer guide does not cover the advanced topic of creating custom dashboards. For guidance on the latter, contact Nevis.
Deployment
nevisReports is delivered as a dedicated nevisAppliance virtual image. As of nevisReports , the image is deployed on exactly one (virtual) machine per Nevis installation.
The Deployment diagram below shows the software components that run on the nevisReports appliance and the connections from external systems to these components. Details can be found in the following table "Deployment connections".
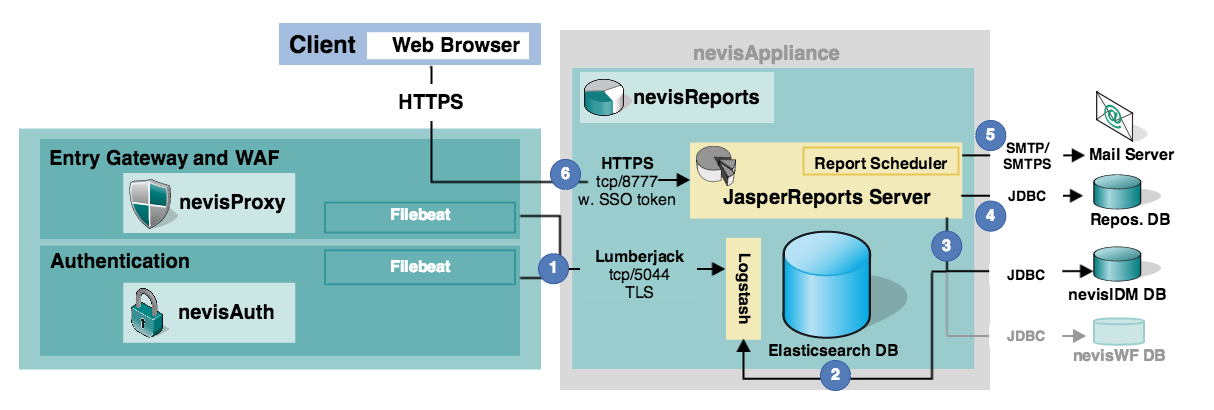
| # | Source component | Destination component | Service | Port | Description |
|---|---|---|---|---|---|
| 1 | Filebeat | Logstash (with logstash-input-beats) | Lumberjack | tcp/5044 | The Filebeat process runs on the nevisProxy and/or nevisAuth machines and sends logs to the Logstash process on the nevisReports appliance. See `http://github.com/logstash-plugins/logstash-input-beats/blob/master/PROTOCOL.md for more details on the used Lumberjack protocol. |
| 2 | nevisIDM database | Logstash (with logstash-input-jdbc) | JDBC | The Logstash process connects to the nevisIDM database at regular intervals to collect data relevant to the reports. | |
| 3 | JasperReports Server | nevisIDM database (Oracle / MySQL)nevisWorkflow database (Oracle) | JDBC | Reports that are based on data managed by nevisIDM or nevisWorkflow are generated using a direct connection to the respective component's database. The note about database support above also applies here. | |
| 4 | JasperReports Server | Repository database(Oracle / MySQL) | JDBC | The JasperReports Server stores internal data and optionally generates reports in a customer-maintained Oracle database. Note: For nevisReports, Nevis does not support database products other than Oracle. Contact Nevis in case you cannot provide an Oracle database so we can advise you on the alternatives. | |
| 5 | JasperReports Server | Mail server | SMTP / SMTPS | Scheduled reports and/or notifications about completed schedules are sent out via SMTP to a company's mail server. | |
| 6 | nevisProxy | JasperReports Server(running within WildFly Java server) | HTTPS | tcp/8777 | An end user connects to the JasperReports Server web application via nevisProxy. nevisProxy is responsible for enforcing end user authentication (SSO, single-sign-on). The user's identity is propagated to the JasperReports Server with every request inside the SSO token. |
Internal connections
The previous figure "Deployment diagram" does not show internal connections between the components running on the nevisReports appliance because the corresponding services are configured automatically and not exposed externally. An example is the connection between the JasperReports Server and Elasticsearch.
Fault-tolerance and capacity planning
It is possible to deploy the third-party components that make up nevisReports, such as the JasperReports Server and Elasticsearch, as clusters onto multiple servers to improve the performance and the system availability and to allow for bigger data sets or more users. In case you require a clustered setup, contact Nevis, so that we can advise you on the available options and licensing implications.
Installation
nevisReports has three components JRS, Elasticsearch and Logstash. There are two different ways to install nevisReports:
- Install nevisAppliance, which is packaged with all the required components needed for nevisReports.
- Install the nevisReports RPMs packages.
Both installation approaches are explained in the following subsections.
System requirements
nevisReports is delivered as an RPM package and a nevisAppliance image that is based on the CentOS Linux distribution. To install nevisReports as a nevisAppliance image, see Installation] machine requirements.
nevisReports consists of various components, each having different requirements on system resources such as CPU, memory and disks. In addition, upstream components such as nevisProxy have an impact on nevisReports system requirements, too – in terms of the volume of data they can generate.
The table below lists the minimum and recommended resource values required for a one-system deployment as described in [Deployment]. The values are based on the following assumptions:
nevisReports usage assumptions
- The overall Nevis installation can support many thousands of users. However, no more than 10 to 20 in
- The peak usage of nevisReports consists of about five concurrent sessions during which reports are actively generated.
- Report jobs are scheduled at off-hours. End users do not concurrently access nevisReports during these off-hours.
- There is a four months period of data retention for Elasticsearch indices.
Upstream system usage assumptions
- nevisProxy handles a maximum of 2,000,000 in
- nevisAuth handles a maximum of 6,000 unique sessions per day.
nevisReports
The table below lists the minimum and recommended resource values required for a one-system deployment of nevisReports:
| Parameter | Minimum | Recommended | Remarks |
|---|---|---|---|
| CPU | 2x4core | 2x4core | |
| Memory | 16 GB | 32 GB | |
| Disk | 150 GB | 250 GB | ~50 GB for OS and software packages. The rest is for Elasticsearch database indices and for the MySQL database if applicable. They should be stored on a fast disk (SSD or locally attached). |
Repository database
The table below lists the minimum and recommended disk size required for the Oracle or MySQL database server:
| Parameter | Minimum | Recommended | Remarks |
|---|---|---|---|
| Disk | 300 MB free | 1 GB free | The required size is estimated for transactional data only. Generated report documents are excluded. |
Notes
- Specify the size of the CPU and the memory of the database server according to the amount of applications that they must support.
- If you intend to schedule and store generated reports in the database, allocate additional size according to your job scheduling frequency, average size of reports and retention policy. Example: Job scheduling frequency and size of reports: 100 x 2MB documents per month. Retention policy: retain reports for three years. Additional size requirement: 100 documents x 2MB per document x 36 months = 7.2 GB
Sizing for your use case
In case of different requirements, contact Nevis for sizing advice specific to your Nevis installation.
Scalability
If you follow the recommendations above, the nevisReports server component will function normally in most environments.
In demanding environments, however, plan to allocate additional resources .
As for the Elasticsearch database, the official documentation provides information on system sizing. Essentially, Elasticsearch system requirements depend on the desired response times and the amount of log data stored in the search index. Some starting points: (https://www.elastic.co/blog/how-to-handle-elasticsearch-virtualization), and(https://www.elastic.co/guide/en/elasticsearch/guide/current/hardware.html).
Minimum versions of Nevis components
To generate the JSON log files that nevisReports can read, you need the following or higher versions of the other Nevis components:
- nevisAppliance 2.201807.0 (recommended is 2.201807.0 or newer),
- nevisProxy 3.12.9,
- nevisAuth 4.19.1,
- nevisIDM 2.66, and
- nevisAdmin 3.4.5 (optional).
The sample nevisIDM report has been tested against nevisIDM 2.66 and higher (with Oracle database) but may also work with older nevisIDM versions as long as these versions use a compatible database schema.
nevisAppliance-based installation
If you installed nevisProxy/nevisIDM/nevisAuth as RPMs instead of with nevisAppliance, you need to install Filebeat separately on each of the nodes running nevisProxy/nevisIDM/nevisAuth. See chapter Filebeat for details.
The nevisReports components, default configurations and supporting scripts are included in the nevisAppliance image of type reports (neviscd2_<version>_nevis_reports.img and neviscd2_<version>_os_reports.img). The instructions in this reference guide apply to this image type only.
To install the image, see the chapter "Installation" in the nevisAppliance reference guide. See the same guide for instructions on updating the installation.
After installation and reboot, the following software components are available:
- Logstash,
- Elasticsearch,
- MySQL (optional) and
- JasperReports Server (this component is also called the nevisReports server because it is modified for nevisReports use).
To be able to deploy these components, perform additional steps. These are explained in the [Configuration] section.
The reports nevisAppliance image type does not contain nevisProxy, nevisAuth or nevisIDM. This means that to test nevisReports independently of any existing Nevis installation, configure at least two (virtual) machines: one with the reports appliance image and one appliance with nevisProxy or other Nevis products.
RPM-based installation
nevisReports is delivered with three RPMs :
- nevisreports-es : This RPM contains Elasticsearch-related configurations and command scripts to operate on Elasticsearch for nevisReports (but Elasticsearch itself is not packaged in this RPM).
- nevisreports-ls : This RPM contains Logstash-related configurations and command scripts to operate on Logstash for nevisReports (but Logstash itself is not packaged in this RPM).
- nevisreports: This RPM contains JasperReports Server (JRS) -related configurations and command scripts to operate on nevisReports.
Details can be found in the following subsections :
If your nevisProxy, nevisAuth and/or nevisIDM are also RPM-based installations (that is, NOT nevisAppliance-based), then you will need to install Filebeat separately on those machines. See chapter Filebeat for details.
nevisreports-es
nevisreports-es is a configuration component for Elasticsearch. It exposes the contracts to configure and manage Elasticsearch for nevisReports. Elasticsearch holds all the transformed data received from Logstash.
Prerequisites
The following software should be pre-installed on the server:
- JDK (OpenJDK)
- Elasticsearch
Support matrix
The table below shows the officially certified versions of the prerequisite software.
| Component | version |
|---|---|
| Elasticsearch | 6.7.1 |
| OpenJDK | 1.8.x |
RPM package installation procedure
Installation
To install the nevisreports-es RPM package, run the following command:
rpm -ivh nevisreports-es-x.x.x.rpm
Uninstallation
To uninstall the nevisreports-es RPM package, run the following command:
rpm -evh nevisreports-es
Upgrade
To upgrade an installed nevisreports-es RPM package to the new version, run the following command:
rpm -Uvh nevisreports-es-x.x.x.rpm
Package information
To query information on an installed nevisreports-es package, use the following command:
rpm -qi nevisreports-es
See Configuring Elasticsearch to configure nevisreports-es.
nevisreports-ls
nevisreports-ls is a configuration component for Logstash. It exposes the contracts to configure and manage Logstash for nevisReports. Logstash receives events from Filebeat instances, transforms them and sends them to Elasticsearch for storage.
Prerequisites
The following software should be pre-installed and configured on the server:
- JDK (OpenJDK)
- Logstash
Support matrix
The table below shows the officially certified versions of the prerequisite software.
| Component | Maximum version |
|---|---|
| Logstash | 6.7.1 |
| OpenJDK | 1.8.x |
RPM package installation procedure
Installation
To install a nevisreports-ls RPM package, run the following command:
JAVA_HOME=<path-to-OpenJDK>
PATH=$PATH:$JAVA_HOME/bin
export JAVA_HOME PATH
rpm -ivh nevisreports-ls-x.x.x.rpm
Uninstallation
To uninstall a nevisreports-ls RPM package, run the following command:
rpm -evh nevisreports-ls
Upgrade
To upgrade an installed nevisreports-ls RPM package to the new version, run the following command:
rpm -Uvh nevisreports-ls-x.x.x.rpm
Package information
To query information about the installed nevisreports-ls package, use the following command:
rpm -qi nevisreports-ls
See Configuring Logstash to configure nevisreports-ls.
nevisreports
The JasperReports Server (JRS) component provides a web interface for end users to generate, view and explore reports. Follow this chapter to get the JasperReports Server web interface up and running.
Technically, the server is the JasperReports Server (JRS) Pro web application running inside the WildFly container.
Prerequisites
The following software should be pre-installed and configured on the server:
- OpenJDK
- MySQL/Oracle
- adnwildfly
- neviskeybox
- neviscred
Support matrix
The tables below show the officially certified versions of the prerequisite software, as well as the required database versions.
| Software | Versions |
|---|---|
| JDK (OpenJDK) | 1.8.x |
| adnwildfly | 10.1.1.x |
| neviskeybox | 2.1.28 |
| neviscred | 2.0.18 |
| Database | Versions |
|---|---|
| MySQL | 5.6.x5.7.x |
| Oracle | 12c R1/R218c 19c |
RPM package installation procedure
Installation
To install the nevisreports RPM package, run the following command:
rpm -ivh nevisreports-x.x.x.rpm
Uninstallation
To uninstall the nevisreports RPM package, run the following command:
rpm -evh nevisreports
Upgrade
To upgrade an installed nevisreports RPM package to the new version, run the following command:
rpm -Uvh nevisreports-x.x.x.rpm
Package information
To query information on the installed nevisreports package, use the following command:
rpm -qi nevisreports
See Configuring JasperReports Server to configure nevisreports.
Filebeat
This section is only applicable if you installed nevisProxy/nevisIDM/nevisAuth as RPMs instead of with nevisAppliance. In this case, you have to install Filebeat as RPM, too. However, If you used nevisAppliance to install Nevis, this chapter is not of interest for you as Filebeat is pre-installed on nevisAppliance.
Filebeat is an agent (from Elastic stack) that runs on the nodes where nevisProxy, nevisAuth and nevisIDM are running. Filebeat helps to transport logs from the nevisProxy/nevisAuth/nevisIDM nodes to the node running nevisreports-ls(the Logstash node).
Supported version
The officially supported version of Filebeat is 6.7.1.
Installation
- Download the officially supported version of Filebeat in .rpm format from the Official Elastic website.
- Install Filebeat on each node running nevisProxy, nevisAuth or nevisIDM, with the following command:
rpm -ivh filebeat-xxx-x86_64.rpm
See Configuring log transport to configure Filebeat.
Support Matrix
The tables below shows various platforms and software configurations that are supported by nevisReports.
Product and Operating System
| RHEL7 | SLES 12 | nevisAppliance v2 | nevisAppliance v1 | |
|---|---|---|---|---|
| nevisreports 1.1 | (error) | (error) | (error) | (tick) |
| nevisreports 1.2 - 2.x | (error) | (error) | (tick) | (error) |
| nevisreports 3.x - 4.x | (tick) | (tick) | (tick) | (error) |
| RHEL7 | SLES 12 | nevisAppliance v2 | nevisApplinance v1 | |
|---|---|---|---|---|
| nevisreports-es 3.x - 4.x | (tick) | (tick) | (tick) | (error) |
| RHEL7 | SLES 12 | nevisAppliance v2 | nevisAppliance v1 | |
|---|---|---|---|---|
| nevisreports-ls 3.x - 4.x | (tick) | (tick) | (tick) | (error) |
Product and Databases
| MySQL Server 5.6.x | Oracle 11 | Oracle 12 | Oracle 18 | Oracle 19 | |
|---|---|---|---|---|---|
| nevisreports 1.x - 3.x | (tick) | (tick) | (error) | (error) | (error) |
| nevisreports 4.x-4.3.0 | (tick) | (tick) | (tick) | (error) | (error) |
| nevisreports 4.3.1 | (tick) | (error) | (tick) | (tick) | (tick) |
Nevis Product Compatibility
| nevisReports | nevisProxy | nevisAuth | nevisIDM |
|---|---|---|---|
| 1.x - 4.3.0 | 3.12.9+ | 4.19.1+ | 2.66+ |
| 4.3.1 | 3.14.3+ | 4.25+ | 2.75+ |
| nevisReports Appliance V2 | Nevis IAM Appliance V2 |
|---|---|
| 2.4.0.0 - 2.4.2.0 | 2.0.0.3 - 2.4.2.2 |
| 2.4.2.2 - 2.201803.x | 2.4.2.2 - 2.201805.3 |
| 2.201807.x+ | 2.201807.x+ |
Product and Elastic stack
| nevisReports | Elasticsearch | Logstash | Filebeat | Logstash Forwarder |
|---|---|---|---|---|
| 1.1 | 1.7 | 1.5 | - | 0.4.0 |
| 1.2 - 3.x | 2.4 | 2.4 | 5.3 | - |
| 4.0 - 4.2 | 6.2.4 | 6.2.4 | 6.2.4, 6.6.x | - |
| 4.3.0 | 6.7.x | 6.7.x | 6.7.x | - |
| 4.3.1+ | 7.9.x | 7.9.x | 7.9.x | - |
Configuration
Configuring event logging
nevisReports relies on JSON-based log formats. These log formats are created by nevisProxy and nevisAuth and written into the Elasticsearch index via Logstash.
The steps to enable JSON-based logging vary for each component. This chapter describes the various steps per component in separate subchapters.
Hosts running nevisProxy
You can either activate event logging via nevisAdmin or manually. Both cases are explained below. Follow the instructions that apply to your configuration strategy. Repeat the instructions for every nevisProxy instance on every host from which you want to collect logs.
nevisAdmin configuration
This chapter explains how to activate event logging for nevisProxy by means of nevisAdmin.
For nevisProxy instances version < 3.13.2.0 that use Apache 2.4, it is necessary to enable event logging manually.
The instructions below assume that the nevisProxy instance has been created already. If this is not the case, see the nevisAdmin reference guide.
Follow the steps illustrated by the screenshot and described in detail below.
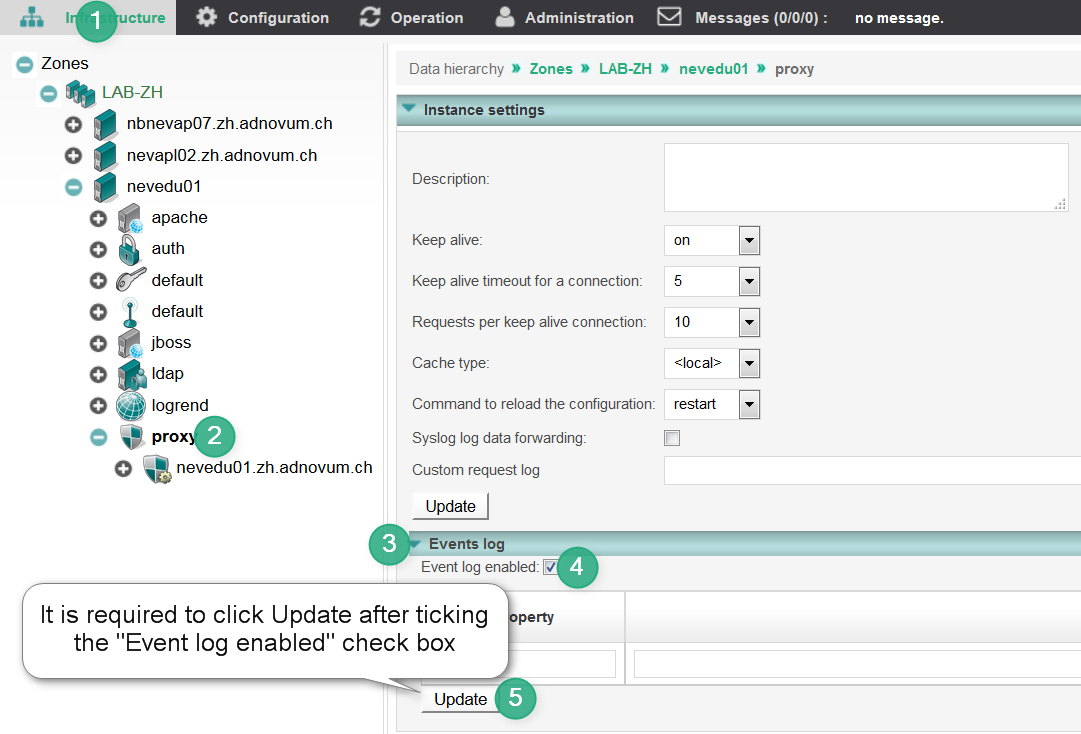
Open the nevisAdmin application and go to the Infrastructure tab.
Open the settings for your nevisProxy instance (it is called proxyin the screenshot).
Open the Events log section.
Tick the Event log enabled checkbox.
Click Updateto store the changed settings.
Commit a new revision and deploy it (this is not shown in the screenshot above).
Proceed to chapter Testing below.
The resulting nevisProxy events log file is located at /var/opt/nevisproxy/$PROXY_INSTANCE_NAME/logs/nevisproxy-events.log.It is rotated as follows: max. 5 files with each max. 100 MB of data. The rotation parameters are not configurable.Manual configuration
Activate event logging for nevisProxy manually
- In the /var/opt/nevisproxy/$PROXY_INSTANCE_NAME/conf/navajo.xml file, add one of the following elements inside the
<server>element. Which element is relevant for you depends upon the nevisProxy version and/or the Apache version of your nevisProxy instance.
Replace <$PROXY_INSTANCE_NAME> with the name of your instance.
For nevisProxy version > 3.13.2.0, add this element:
nevisProxy instance
<CustomLogs>"|/bin/sed -u -e s/'\\\\\\\\x'/'\\\\\\\\\\\\\\\\x'/g|/opt/nevisproxy/bin/bclogmgr size=100000000 archives=5 /var/opt/nevisproxy/$PROXY_INSTANCE_NAME/logs/nevisproxy-events.log" "{ \"logVersion\":\"2\", \"logType\":\"req\", \"timestamp\":\"%{%FT%T}t.%{msec_frac}t%{%z}t\", \"clientIP\":\"%a\", \"xForwardedFor\":\"%{X-Forwarded-For}i\", \"trID\":\"%{UNIQUE_ID}e\", \"sessionID\":\"%{SESSION_ID}e\", \"sslProtocol\":\"%{SSL_PROTOCOL}e\", \"sslCipher\":\"%{SSL_CIPHER}e\", \"sslClientDN\":\"%{SSL_CLIENT_S_DN}e\", \"serviceName\":\"%v\", \"port\":%p, \"reqMethod\":\"%m\", \"reqPath\":\"%U\", \"reqQuery\":\"%q\", \"userAgent\":\"%{User-Agent}i\", \"referer\":\"%{Referer}i\", \"inContentType\":\"%{Content-Type}i\", \"outContentType\":\"%{Content-Type}o\", \"status\":%>s, \"dT\":%D, \"originalStatus\":\"%{originalHTTPStatus}e\", \"sCB\":\"%{sCB}e\", \"dTF\":\"%{dTF}e\", \"dTB\":\"%{dTB}e\", \"invS\":\"%{invS}e\", \"adrB\":\"%{adrB}e\", \"ipB\":\"%{ipB}e\", \"events\":\"%{Event}e\", \"userID\":\"%u\", \"loginID\":\"%{LOGIN_ID}e\", \"inBytes\":%I, \"outBytes\":%O, \"custom\": { } }"</CustomLogs>
For nevisProxy version < 3.13.2.0 and running with Apache 2.4 or higher, add the following configuration:
nevisProxy instance (version < 3.13.2.0) Apache version 2.4
<CustomLogs>"|$/bin/sed -u -e s/'\\\\\\\\x'/'\\\\\\\\\\\\\\\\x'/g|/opt/nevisproxy/bin/bclogmgr size=100000000 archives=5 /var/opt/nevisproxy/$PROXY_INSTANCE_NAME/logs/nevisproxy-events.log" "{ \"logVersion\":\"2\", \"logType\":\"req\", \"timestamp\":\"%{%FT%T}t.%{msec_frac}t%{%z}t\", \"clientIP\":\"%a\", \"xForwardedFor\":\"%{X-Forwarded-For}i\", \"trID\":\"%{UNIQUE_ID}e\", \"sessionID\":\"%{SESSION_ID}e\", \"sslProtocol\":\"%{SSL_PROTOCOL}e\", \"sslCipher\":\"%{SSL_CIPHER}e\", \"sslClientDN\":\"%{SSL_CLIENT_S_DN}e\", \"serviceName\":\"%v\", \"port\":%p, \"reqMethod\":\"%m\", \"reqPath\":\"%U\", \"reqQuery\":\"%q\", \"userAgent\":\"%{User-Agent}i\", \"referer\":\"%{Referer}i\", \"inContentType\":\"%{Content-Type}i\", \"outContentType\":\"%{Content-Type}o\", \"status\":%>s, \"dT\":%D, \"originalStatus\":\"%{originalHTTPStatus}e\", \"sCB\":\"%{sCB}e\", \"dTF\":\"%{dTF}e\", \"dTB\":\"%{dTB}e\", \"invS\":\"%{invS}e\", \"adrB\":\"%{adrB}e\", \"ipB\":\"%{ipB}e\", \"events\":\"%{Event}e\", \"userID\":\"%u\", \"loginID\":\"%{LOGIN_ID}e\", \"inBytes\":%I, \"outBytes\":%O, \"custom\": { } }"</CustomLogs>
Do not change the properties and values in the code blocks above. The only exception is the custom { } block at the end, where you can add additional JSON properties. For details, see the nevisReports developer guide, chapter Custom Log Properties.The sed command at the beginning guarantees that Apache \xNN sequences are properly JSON-escaped. 2. Restart the nevisProxy instance.
Advanced configuration
In addition to the standard configuration of the event logging, you can configure some advanced features such as reliable session ID logging. This chapter explains how to do that.
Reliable session ID logging
After a client has successfully established a nevisProxy session, nevisProxy logs the session ID during subsequent requests for protected resources only. By default, nevisProxy does not log the session ID when unprotected resources, such as publicly available images or error pages, are requested. The reason for this is that retrieving the session ID can have a noticeable impact on the performance, especially when remote (database) session storage is being used.
However, some customers may want to log the session ID for every request that occurs within a session, e.g., to include the requests in session audit reports or to support operations. It is possible to change the default behavior accordingly if the following applies:
- nevisProxy is configured to use container session handling (as defined in the nevisProxy reference guide, chapter "Session Handling Concepts"), and
- nevisProxy 3.12.12.1 or higher is used.
To change the default behavior of nevisProxy to log the session ID for every session request, perform the following steps:
- Locate the bc.properties file:
- In the case of a nevisAdmin configuration
- open the settings for your nevisProxy instance (see nevisAdmin configuration,
- open the File manager section, and
- click the Edit icon in front of the bc.properties file.
- In the case of a manual configuration, you can find the bc.properties file here: /var/opt/nevisproxy/$PROXY_INSTANCE_NAME/conf/bc.properties
- Inside the file, set the following property:
ch.nevis.navajo.TraceClIdAlwaysIfSessionIsThere=true
Activate the change:
In case of a nevisAdmin configuration, commit a new revision and deploy.
In case of a manual configuration, restart the nevisProxy instance.
Logging originalHttpStatus
This configuration is needed only if you reset HTTP status codes sent to the client browser.
Some nevisProxy setups make use of an ErrorFilter to reset HTTP status codes sent to the client browser. For example, if a protected application response contains HTTP status 503, an ErrorFilter can be configured to reset the code to a more generic status 500 or even a success status 200. One motivation for such configurations is to implement the fail-closed principle. Regardless of the motivation, if the HTTP status sent to the client browser is altered or reset in any way, one should log the original HTTP status to event logging so that nevisReports can accurately display it in various reports and dashboards.
To do so, add the following LuaFilter right after the status-resetting ErrorFilters. The LuaFilter stores the original unchanged HTTP status in a placeholder environment variable, which is then outputted to event logs.
web.xml
<!-- INSTRUCTION: define the following LuaFilter -->
<!-- Save HTTP status code into originalHTTPStatus ENV variable for logging -->
<filter>
 <filter-name>SaveHTTPStatusFilter</filter-name>
 <filter-class>ch::nevis::isiweb4::filter::lua::LuaFilter</filter-class>
 <init-param>
 <param-name>Script.OutputFunctionName</param-name>
 <param-value>saveHTTPStatus</param-value>
 </init-param>
 <init-param>
 <param-name>Script</param-name>
 <param-value>
 function saveHTTPStatus(req, resp, chunk)
 if not req:getEnv("originalHTTPStatus") then
 req:setEnv("originalHTTPStatus", resp:getStatus())
 end
 return chunk
 end
 </param-value>
 </init-param>
</filter>
....
<!-- INSTRUCTION: add the new filter mapping right after error filter (which may hide the original status code)
so that during response processing, it will be executed right before the error filter -->
<filter-mapping>
 <filter-name>SaveHTTPStatusFilter</filter-name>
 <url-pattern>/*</url-pattern>
</filter-mapping>
Testing
To test whether the activation of the event logging was successful, perform the following steps:
- Submit a request to your nevisProxy instance.
- Verify that the request is logged inside /var/opt/nevisproxy/$PROXY_INSTANCE_NAME/logs/nevisproxy-events.log
.
Hosts running nevisAuth
You can either activate event logging via nevisAdmin or manually. Both cases are explained below.
Follow the instructions that apply to your configuration strategy. Repeat the instructions for every nevisAuth instance on every host from which you want to collect logs.
For nevisAuth versions >= 4.22.0.0 refer to nevisAuth Reference Guide - Event Logging chapter to enable event logging. For versions lower than 4.22.0.0 find the necessary information in the following sections.
nevisAdmin configuration
This chapter explains how to activate event logging for nevisAuth by means of nevisAdmin.
The instructions below assume that the nevisAuth instance has been created already. If not, do the following:
- Create the instance in nevisAdmin and assign it to a realm. See the nevisAdmin reference guide for details.
- Create a new revision (with Commit) and deploy.
- The instance is created on the target host.
- Continue with the steps below.
Follow the steps illustrated by the screenshot and described in detail below:
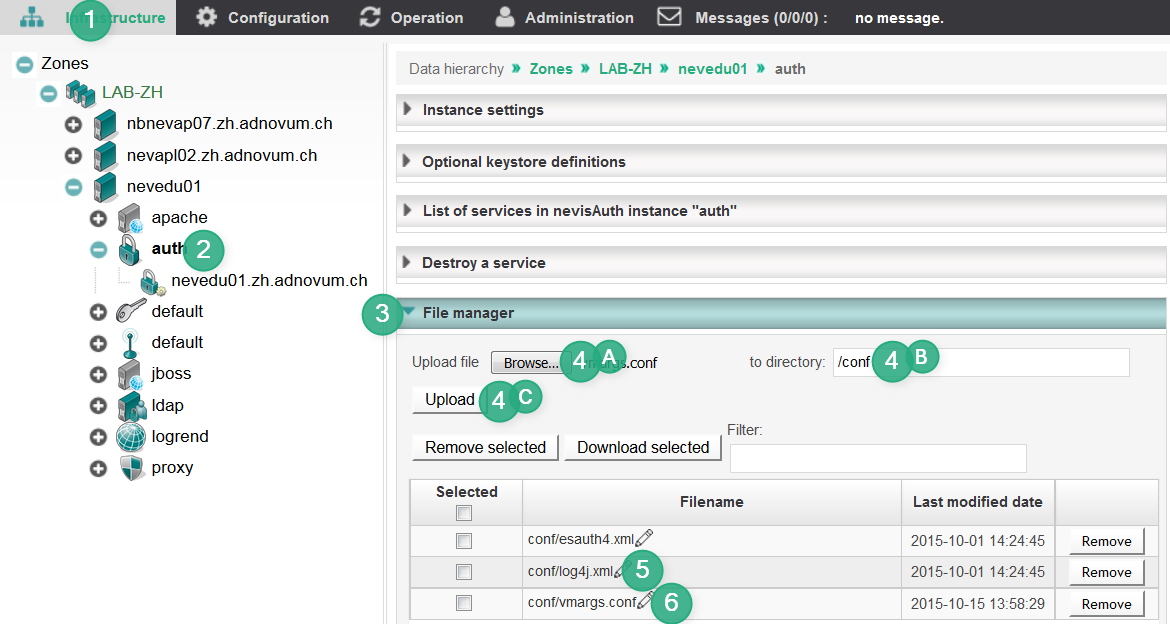
- Open the nevisAdmin application and go to the Infrastructure tab.
- Open the settings for your nevisAuth instance (it is called authin the screenshot).
- Open the File manager section.
- Check that the file conf/vmargs.conf is listed in the File manager section. If not, perform the following steps:
- Click Browse to upload the current version of the file vmargs.conf.
- You can find the file inside /var/opt/nevisauth/<AUTH_INSTANCE_NAME>/conf/vmargs.conf on your nevisAuth host (replace <AUTH_INSTANCE_NAME> with the actual instance name).
- Enter /conf in the to directory field.
- Click Upload.
- If your nevisAuth instance was initially created with nevisAdmin 3.4.6.x or earlier, you need to do the following:
Open the file conf/log4j.xml and verify that the log4j configuration includes the following (uncommented) blocks (see below). If they are missing, add them.
<!-- Events reporting in JSON -->
<appender name="EVENTS" class="org.apache.log4j.RollingFileAppender">
 <param name="File" value="log/nevisauth-events.log"/>
 <param name="Append" value="true"/>
 <param name="MaxFileSize" value="10MB"/>
 <param name="MaxBackupIndex" value="9"/>
 <layout class="org.apache.log4j.PatternLayout">
 <param name="ConversionPattern" value="%m%n"/>
 </layout>
</appender>
<category name="nevis.events" additivity="false">
<priority value="TRACE"/>
<appender-ref ref="EVENTS"/>
</category>
- Open the file conf/vmargs.conf and add, or uncomment, the following line (replace <AUTH_INSTANCE_NAME> with the actual instance name):
-Dch.nevis.events.config=/var/opt/nevisauth/<AUTH_INSTANCE_NAME>/conf/nevisevents.xml
- Commit a new revision and deploy (this is not shown in the screenshot above).
- Proceed with chapter Testing below.
Manual configuration
This chapter explains how to activate event logging for nevisAuth manually.
Follow these steps:
- In the command line, define the name of the nevisAuth instance (subdirectory in /var/opt/nevisauth/). Then, verify that the file nevisevents.xml exists in the instance configuration:
AUTH_INSTANCE_NAME=...
ls /var/opt/nevisauth/$AUTH_INSTANCE_NAME/conf/nevisevents.xml
The file should already exist for instances created with nevisAuth 4.19 and higher. If the file does not exist:
Copy it from the template below.
Replace the @variables@ with the correct values.
cp /opt/nevisauth/template/conf/nevisevents.xml /var/opt/nevisauth/$AUTH_INSTANCE_NAME/conf/nevisevents.xml
chown nvauser:nvbgroup /var/opt/nevisauth/$AUTH_INSTANCE_NAME/conf/nevisevents.xml
sed -i /var/opt/nevisauth/$AUTH_INSTANCE_NAME/conf/nevisevents.xml -e "s|@PKG_VAR@/@PKG_INSTANCE@|/var/opt/nevisauth/$AUTH_INSTANCE_NAME|"In the file /var/opt/nevisauth/$AUTH_INSTANCE_NAME/conf/vmargs.conf, enable the nevisevents subsystem by including the following vmargs parameter (see the code line below).
Replace the <AUTH_INSTANCE_NAME> inside the parameter with the actual instance name.
-Dch.nevis.events.config=/var/opt/nevisauth/<AUTH_INSTANCE_NAME>/conf/nevisevents.xml
- In the file /var/opt/nevisauth/$AUTH_INSTANCE_NAME/conf/log4j.xml, verify that the log4j configuration includes the following (uncommented) blocks (see below). If they are missing, add them.
<!-- Events reporting in JSON -->
<appender name="EVENTS" class="org.apache.log4j.RollingFileAppender">
<param name="File" value="log/nevisauth-events.log"/>
<param name="Append" value="true"/>
<param name="MaxFileSize" value="10MB"/>
<param name="MaxBackupIndex" value="9"/>
<layout class="org.apache.log4j.PatternLayout">
<param name="ConversionPattern" value="%m%n"/>
</layout>
</appender>
 <category name="nevis.events" additivity="false">
 <priority value="TRACE"/>
 <appender-ref ref="EVENTS"/>
 </category>
- Restart the nevisAuth instance.
Testing
To test whether the activation of the event logging was successful, perform the following steps:
- Successfully log in to an application.
- Verify that log events appear in /var/opt/nevisauth/$AUTH_INSTANCE_NAME/log/nevisauth-events.log.
nevisAuth log4j configuration snippets
nevisReports log4j appender
<!-- Events reporting in JSON -->
<appender name="EVENTS" class="org.apache.log4j.RollingFileAppender">
 <param name="File" value="log/nevisauth-events.log"/>
 <param name="Append" value="true"/>
 <param name="MaxFileSize" value="10MB"/>
 <param name="MaxBackupIndex" value="9"/>
 <layout class="org.apache.log4j.PatternLayout">
 <param name="ConversionPattern" value="%m%n"/>
 </layout>
</appender>
nevisReports log4j category
 <category name="nevis.events" additivity="false">
 <priority value="TRACE"/>
 <appender-ref ref="EVENTS"/>
 </category>
Hosts running nevisIDM
Event logging in nevisIDM can only be done manually.
This feature is supported in nevisIDM from 2.61.0 onward.
Proceed as follows to set up event logging in nevisIDM:
- Add the following configuration to the nevisidm-prod.properties file (/var/opt/nevisidm/<NEVISIDM_INSTANCE_NAME>/conf/nevisidm-prod.properties):
auditModule.enabled=true
auditModule.provider=jsonAuditProvider
auditFile=/var/opt/nevisidm/<NEVISIDM_INSTANCE_NAME>/log/nevisidm-events.log
- Restart nevisIDM.
For more information, see the nevisIDM Reference Guide, chapter "Auditing".
Configuring log transport
It is possible to transfer logs to nevisReports either via the Filebeat tool or via remote Syslog. This section covers the Filebeat and Logstash configuration aspects.
Setting up Syslog is not within the scope of this reference guide. Refer to the standard Syslog and Logstash documentation in case you choose the Syslog solution.
This guide is written for nevisAppliance 2.201807 or newer, operated with Filebeat version 6.2.4.
Log transport overview
Filebeat is an agent that runs on the nodes from where the log data is transported. Logstash is responsible for receiving and transforming the log data as well as storing the log data in Elasticsearch. One can think of it as an Extract, Transform and Load (ETL) tool specialized in handling log data.
The figure below gives an overview of the log transport within nevisReports by means of Logstash:
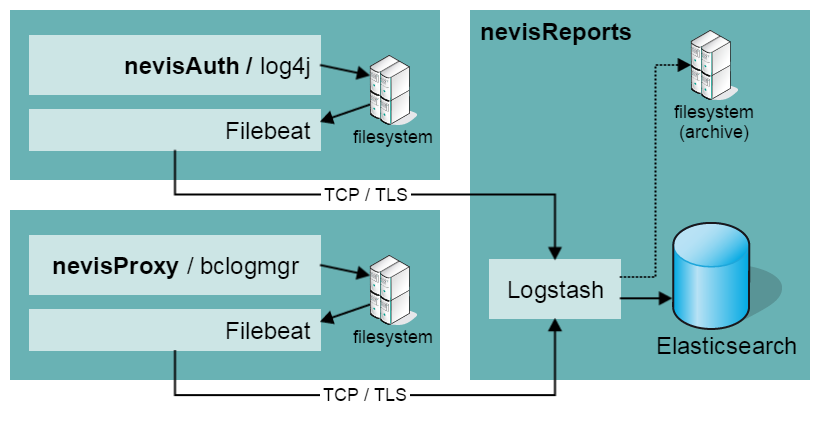
Configuring and securing components
Advanced topics
For further configuration options, see the [Administration] chapter.
Configuring Filebeat
This chapter describes how to configure Filebeat.
Filebeat configuration on sending hosts
To configure Filebeat on the sending hosts, follow the steps below.
The following configuration is needed for all sending hosts, that is, for all hosts where nevisProxy, nevisAuth or nevisIDM runs.
- On the sending hosts, create the file /etc/filebeat/filebeat.yml with the following content:
You could use the existing filebeat.reference.yml as a reference. If you do not use this reference file, you could also remove it.
The Filebeat versions 6.2 and 6.6 and 7.9 ([find out more for 7.9] have slightly different configurations. Choose the correct configuration according to the version of Filebeat that you have installed.
Configuration for Filebeat version 6.2
filebeat:
  prospectors:
    -
      paths: ["/var/opt/nevisproxy/*/log*/*-events.log*"]
      exclude_files: ['\.gz$']
      fields_under_root: true
      fields:
        host: "<local-host-name>"
        type: "nevisproxy-events"
    -
      paths: ["/var/opt/nevisauth/*/log*/*-events.log*"]
      exclude_files: ['\.gz$']
      fields_under_root: true
      fields:
        host: "<local-host-name>"
        type: "nevisauth-events"
    -
      paths: ["/var/opt/nevisidm/*/log/*-events.log*"]
      exclude_files: ['\.gz$']
      fields_under_root: true
      fields:
        host: "<local-host-name>"
        type: "nevisidm-events"
output:
  logstash:
    hosts: ["<fqdn-of-nevisreports-host>:5044"]
    # To secure log transfer with TLS see chapter "Securing log transfer with TLS"
    # ssl.certificate_authorities: ["/var/opt/neviskeybox/<instance>/<slot>/truststore/<name>.pem"]

logging:
  to_files: true
  files:
    path: /var/log/filebeat
    name: filebeat.log
    rotateeverybytes: 10485760 # = 10MB
    keepfiles: 7
  level: error
Configuration for Filebeat version 6.6
filebeat:
  prospectors:
    -
      paths: ["/var/opt/nevisproxy/*/log*/*-events.log*"]
      exclude_files: ['\.gz$']
      fields_under_root: true
      fields:
        type: "nevisproxy-events"
    -
      paths: ["/var/opt/nevisauth/*/log*/*-events.log*"]
      exclude_files: ['\.gz$']
      fields_under_root: true
      fields:
        type: "nevisauth-events"
    -
      paths: ["/var/opt/nevisidm/*/log/*-events.log*"]
      exclude_files: ['\.gz$']
      fields_under_root: true
      fields:
        type: "nevisidm-events"

processors:
 - drop_fields:
     fields: ["host"]

output:
  logstash:
    hosts: ["<fqdn-of-nevisreports-host>:5044"]
    # To secure log transfer with TLS see chapter "Securing log transfer with TLS"
    # ssl.certificate_authorities: ["/var/opt/neviskeybox/<instance>/<slot>/truststore/<name>.pem"]

logging:
  to_files: true
  files:
    path: /var/log/filebeat
    name: filebeat.log
    rotateeverybytes: 10485760 # = 10MB
    keepfiles: 7
  level: error
Configuration for Filebeat version 7.9
filebeat:
  inputs:
    -
      paths: ["/var/opt/nevisproxy/*/log*/*-events.log*"]
      exclude_files: ['\.gz$']
      fields_under_root: true
      fields:
        type: "nevisproxy-events"
    -
      paths: ["/var/opt/nevisauth/*/log*/*-events.log*"]
      exclude_files: ['\.gz$']
      fields_under_root: true
      fields:
        type: "nevisauth-events"
    -
      paths: ["/var/opt/nevisidm/*/log/audit.log*"]
      exclude_files: ['\.gz$']
      fields_under_root: true
      fields:
        type: "nevisidm-events"

processors:
- rename.fields:
  - from: "host.name"
    to: "tempHost"
- drop_fields.fields:
  - "host"
- rename.fields:
  - from: "tempHost"
    to: "host"

output:
  logstash:
    hosts: ["<fqdn-of-nevisreports-host>:5044"]
    # To secure log transfer with TLS see chapter "Securing log transfer with TLS"
    # ssl.certificate_authorities: ["/var/opt/neviskeybox/<instance>/<slot>/truststore/<name>.pem"]

logging:
  to_files: true
  files:
    path: /var/log/filebeat
    name: filebeat.log
    rotateeverybytes: 10485760 # = 10MB
    keepfiles: 7
  level: error
YAML files (usually `.yml`) are whitespace- and indentation-sensitive. While writing YAML configuration files, make sure to use proper indentation and whitespace. 2. In the just added file (see above), fill in the blanks for the local-host-name,*fqdn-of-nevisreports-host and port values.
- For more information on the network section, see the official Filebeat (elastic) configuration documentation.
- The system uses the local-host-name value to archive or query logs that are sent by the sending host. We recommend using either a short host name like "nevedu01" or the host's FQDN.
- Restart (or start) the Filebeat daemon with the following command:
systemctl enable filebeat
systemctl restart filebeat
- Check the following file for log output: /var/log/filebeat/filebeat.log. Log lines that appear inside any of the -events.log files should trigger messages similar to the following:
2016-10-06T14:24:51+02:00 INFO Events sent: 1
2016-10-06T14:24:51+02:00 INFO Registry file updated. 4 states written.
2016-10-06T14:25:21+02:00 INFO Events sent: 2
2016-10-06T14:25:21+02:00 INFO Registry file updated. 4 states written.
Configuring Logstash
To configure the Logstash Server, it is possible to pass in a template properties file during handover. There is one customizable template provided out of the box: /opt/nevisreports-ls/templates/config/nevisreports-ls.properties. Among others, the nevisIDM database connection details are configured in the nevisreports-ls.propertiesfile. You need these connection details for the reports and dashboards that require data aggregation from nevisIDM.
- Create the initial configuration file for the server by copying an available template and adapting it to the current environment (see the following command). For more information about configuring the configuration file as well as the available configuration properties, see the section [Logstash properties] below.
cp /opt/nevisreports-ls/templates/config/nevisreports-ls.properties /tmp/nevisreports-ls.properties
- To configure the server component, run the handover command:
JAVA_HOME=<put-your-path>
export JAVA_HOME
nevisreports-ls handover /tmp/nevisreports-ls.properties
After handover has completed, the system stores a copy of the properties file in /var/opt/nevisreports-ls/default/config/nevisreports-ls.properties. The system will use this file when running administration commands, such as updating the configuration files (mainly configuration management).
Be sure to set the JAVA_HOME variable with the correct JDK path, before running the nevisreports-ls commands. Never set the JAVA_HOME variable with a JRE path.
Command usage
This section explains the usage and syntax of several commands.
- To create a default instance of nevisreports-ls,run the following command:
nevisreports-ls inst create /tmp/nevisreports-ls.properties
nevisreports-ls does not support the creation of multiple instances.
- To remove a default instance of nevisreports**-ls,run the following command:
nevisreports-ls inst remove
- To perform a complete default installation end-to-end, run the following command:
nevisreports-ls handover /tmp/nevisreports-ls.properties
- To redeploy default instance configurations, use the following command:
nevisreports-ls redeploy
- To deploy both standard and custom Logstash configurations from /opt to /var/opt, run the following command:
nevisreports-ls deploy-logstash-configs
- To find out the version of the package, run the command below. Add "-a" to display the version of both the package and Logstash.
nevisreports-ls pkg
nevisreports-ls pkg -a
- To start the events services, run the following command:
systemctl start nevisreports-ls@events
- To stop the events services, run the following command:
systemctl stop nevisreports-ls@events
- To display the status of the events services, run the following command:
systemctl status nevisreports-ls@events
- To view the complete logs of the events services, run the following command:
journalctl -u nevisreports-ls@events
Logstash properties
The table below lists the properties used to configure the Logstash events instances. Credentials for the nevisIDM database are only required when trying to connect to nevisIDM with REST API.
| Property name | Default value | Description |
|---|---|---|
| nevis.reports.include-standard-logstash-events-confs | * | Specifies which standard Logstash configuration files to include during the deployment of the Logstash configuration (with the deploy-logstash-configs command). Some details:* It is possible to enter space-separated file names. Shell wildcards are allowed. |
- The file names are matched within /opt/nevisreports-ls/templates/logstash.d/events.
- To not include any standard conf files, set the property to empty.
- The events configuration files start without 's' (e.g., 10-filter...).
|
| nevis_reports_es_base_url |
<http://localhost:9200>| Defines the Elasticsearch end point. | | nevis_reports_nevisidm_jdbc_connection_string |jdbc:mariadb://...| Defines the JDBC connection URL. | | nevis_reports_nevisidm_db_user |dbusername| Defines the JDBC database user name.Create a read-only user for the nevisIDM database. | | nevis_reports_nevisidm_db_password |password| Defines the JDBC database password.To avoid having a plain text password in this property file, store the password(s) in nevisCred. However, note that Logstash only supports plain text credentials. |
# specify which standard logstash conf files to include during deploy-logstash-configs
# - space-separated file names that may contain shell wildcards
# - file names are matched inside /opt/nevisreports/logstash/template-logstash.d/events
# - set to empty to not include any standard conf files
# - NOTE that events confs start without 's' (e.g., 10-filter...)
# example: nevis.reports.include-standard-logstash-events-confs=10*
nevis.reports.include-standard-logstash-events-confs=*

# Elasticsearch endpoint that logstash collector instance queries data from.
# The default value "http://localhost:9200" should not be changed unless
# you made customizations to the default Elasticsearch setup
nevis_reports_es_base_url=http://localhost:9200

# JDBC connection string to connect to nevisIDM database (Jasper)
# nevis_reports_nevisidm_jdbc_connection_string=jdbc:oracle:thin:@//DBHOST:DBPORT/SERVICENAME
nevis_reports_nevisidm_jdbc_connection_string=jdbc:mariadb://DBHOST:DBPORT/DBNAME?useUnicode=true&characterEncoding=UTF-8&autoReconnect=true&autoReconnectForPools=true

# DB username and password to connect to nevisIDM database (Jasper)
nevis_reports_nevisidm_db_user
nevis_reports_nevisidm_db_password

# Threshold duration used by nevisReports report(s) to determine whether a user is dormant.
# If a user didn't login during the given threshold, then the user is considered dormant.
# The value must be an integer and the unit is in days
nevis_reports_dormant_threshold=180
Configuring Elasticsearch
Configuration
Install the default configuration and start Elasticsearch by executing the following command:
JAVA_HOME=<put-your-path>
export JAVA_HOME
nevisreports-es handover
Be sure to set the JAVA_HOME variable with the correct JDK path, before running the nevisreports-es commands. Never set the JAVA_HOME variable with a JRE path.
Command usage
This section explains the usage and syntax of several commands.
- To create a default instance of nevisreports-es, run the following command:
nevisreports-es inst create
nevisreports-es does not support the creation of multiple instances.
- To remove a default instance of nevisreports**-es, run the following command:
nevisreports-es inst remove
- To perform a complete default installation end-to-end, run the following command:
nevisreports-es handover
- To redeploy a default instance, run the following command:
nevisreports-es redeploy
- To deploy Elasticsearch search template scripts from /opt to /var/opt, run the following command :
nevisreports-es deploy-installed-es-scripts
- To find out the version of the package, run the command below. Add "-a" to display the version of both the package and Elasticsearch.
nevisreports-es pkg
nevisreports-es pkg -a
- To deploy the Elasticsearch search template .zip file, run the command below. The .zip file is normally used during development.
<type>is either "standard" or "custom".
nevisreports-es deploy-es-scripts 10-<type>-es-scripts.zip
- To start the service, run the following command:
systemctl start nevisreports-es
- To stop the service, run the following command:
systemctl stop nevisreports-es
- To display the status of service, run the following command:
systemctl status nevisreports-es
- To view the complete log, run the following command:
journalctl -u nevisreports-es
Configuring repository database
JasperReports Server requires a database to manage internal details like its catalogs and users. Supported are both MySQL and Oracle. The default solution is a local MySQL database. It is possible to configure JasperReports to use an externally hosted database.
Gather the following information before continuing with [Configuring JasperReports Server]:
- Database user name
- Database password
- Database host
- Database port
- Database name
- Oracle only: service name
MySQL
This section walks through the installation and preparation of the MySQL server on the nevisAppliance. If you use an existing MySQL database, you can skip this section.
Perform the steps below to configure the MySQL server.
- JasperReports Server requires a database admin user to function properly. By default, MySQL provides the root user as the database admin user.
- The MySQL server installed with the nevisAppliance is the only officially supported version. Currently, this is MySQL Server version 5.6.x.
Configuring the local MySQL database
- Create a MySQL instance by setting certain configuration parameters in the /etc/my.cnf file (see the code block below). If the file does not exist, create it. It should contain the following basic configuration parameters required for the nevisReports JRS repository:
Click here to expand.../etc/my.cnf
###########################################################
# The following options will be passed to all MySQL clients:
[client]
port = 3306
# The MySQL server
[mysqld]
## BEGIN: nevisreports mysql specific setup
init_connect = 'SET AUTOCOMMIT=0'
lower_case_table_names = 1
bind-address = 127.0.0.1
transaction-isolation = READ-COMMITTED
## END: nevisreports mysql setup
port = 3306
skip-external-locking
table_open_cache = 4
server-id = 1
[mysqld_safe]
log-error=/var/log/mysql/mysqld.log
# Uncomment the following if you are using InnoDB tables:
innodb_data_home_dir = /var/lib/mysql/
innodb_data_file_path = ibdata1:10M:autoextend
innodb_log_group_home_dir = /var/lib/mysql/
innodb_buffer_pool_size = 16M
innodb_additional_mem_pool_size = 2M
innodb_log_file_size = 5M
innodb_log_buffer_size = 8M
innodb_flush_log_at_trx_commit = 1
innodb_lock_wait_timeout = 50
##########################################################
- Start the MySQL server instance as service (daemon):
/etc/init.d/mysql start
To check if the MySQL server is up and running properly, use sudo /etc/init.d/mysql status. 3. Create the "jasperserver" database required to run the JasperReports Server. For this, use the default MySQL login:
mysql -u root -p -e 'CREATE DATABASE jasperserver CHARACTER SET utf8;'
Securing MySQL
To secure the MySQL database, we recommend performing the following steps:
- Immediately change the password of the MySQL root user, by using the command below. Enter a new password on the command line when asked.
/usr/bin/mysqladmin -u root password
- Create a user who has access to the "jasperserver" database only. See the MySQL documentation for more information.
Always avoid using anonymous users.
Important links to set, change or update root/user passwords are:
`http://www.howtoforge.com/setting-changing-resetting-mysql-root-passwords
http://dev.mysql.com/doc/refman/5.7/en/resetting-permissions.html/`
Oracle
JasperReports Server requires a schema-owner account to function properly. Create the schema-owner user based on the instructions in section Manually Creating the JasperReports Server Database in the JRS installation guide.
If needed, consult your Oracle DBA for assistance. Here are some hints for configuring Oracle:
- JRS does not require a dedicated database instance; a schema is sufficient.
- See System requirements for information about database sizing.
- Unicode support: JRS works with NCHAR* text types, which use Oracle's "national character set". This character set is always Unicode-compatible, so there are no special Unicode configuration requirements for Oracle databases. Refer to your Oracle database documentation for more information on this topic.
Configuring JasperReports Server
The JasperReports Server (JRS) component provides a web interface for end users to generate, view and explore reports. Follow this chapter to get the JasperReports Server web interface up and running.
Technically, the server is the JasperReports Server (JRS) Pro web application running inside the WildFly container.
Prerequisites
The server's "repository" data is stored either into a MySQL or into an Oracle database ).
- A running Elasticsearch server, see Configuring Elasticsearch.
- Repository database connection details, see Configuring repository database.
- HTTPS node certificates, a self-signed certificate can be generated using nevisKeybox:
neviskeybox handover
PASSPHRASE=password neviskeybox selfcert -label node -batch
PASSPHRASE=password neviskeybox access -label node -user root -group nvbgroup
- (Optional): nevisIDM database connection details, this usually requires remote access to the nevisIDM database. See the nevisIDM reference guide for more details.
Server configuration
During handover, a template properties file can be passed in to configure the JasperReports Server. There are two templates provided out of the box to be customized:
- /opt/nevisreports/templates/reports/nevisreports-mysql.properties, which is preconfigured with settings for following the [MySQL] guide.
- /opt/nevisreports/templates/reports/nevisreports-oracle.properties, which needs to be adapted when using Oracle as the repository database.
Create the initial configuration file for the server by copying an available template and adapting it to the current environment. See below for a detailed explanation of available configuration properties.
cp /opt/nevisreports/templates/reports/nevisreports-mysql.properties /tmp/nevisreports.properties
### Oracle: cp /opt/nevisreports/templates/reports/nevisreports-oracle.properties /tmp/nevisreports.properties
vi /tmp/nevisreports.properties
Credentials
To avoid plain text credentials in the configuration properties of nevisReports, it is possible to use nevisCred or other (shell-based) vaults. The reference guide does not secure credentials in WildFly or Logstash; see the WildFly documentation - about how to secure credentials in the container (like data sources).
Note that your password vault service must be running and credentials must be inserted before you begin the nevisReports installation. For details about using nevisCred, see the nevisCred reference guide.
Use neviscred:// or pipe:// tokens to avoid setting clear text passwords in nevisreports.properties
dbPassword=neviscred://JASPERDB_PW
dbPassword=pipe://[shell command to retrieve password from a vault]
dbPassword=pipe:///bin/echo password # Example: This would use "password
JasperReports properties
This chapter describes the JasperReports properties to configure the repository database credentials and SMTP connection details.
Connection properties are different for MySQL and Oracle.
Follow the instructions in the template file.
| Property name | Default value | Description |
|---|---|---|
| dbType | mysql | Type of the repository database, either mysql or oracle. |
| dbHost | localhost | Host on which the repository database is running. |
| dbUsername | root | Name of the database user with access to the repository database. For Oracle, this is the schema-owner account. |
| dbPassword | password | Password for the repository database user.To avoid plain text passwords in the configuration file, store the credentials in nevisCred. Additional configuration is required in WildFly to protect all credentials. |
| dbPort | 3306 | Port number of the database server. |
| js.dbName | jasperserver | Database name. |
| sysUsername | Oracle only: repeat dbUsername. | |
| sysPassword | Oracle only: repeat dbPassword. | |
| sid | Oracle only: SID to build the JDBC URL. | |
| serviceName | Oracle only: If you use an Oracle service name instead of sid, use this property. It is used in JDBC URLs as follows: jdbc:tibcosoftware:<oracle://host:1521;ServiceName=servicename> | |
| quartz.mail.sender.host | localhost | Host on which the SMTP server is running. |
| quartz.mail.sender.port | 25 | SMTP port. |
| quartz.mail.sender.username | SMTP server user name (default is blank). | |
| quartz.mail.sender.password | SMTP server password (default is blank). |
WildFly properties
The table below listst the SSL keystore properties to configure the HTTPS server identity. The keystore must be .jks format. The defaults assume a self-signed certificate as created with nevisKeybox in the prerequisites.
Note that you can set these properties only during handover or instance creation (the handover commend internally calls the instance creation). So any changes made after handover and instance creation are not applied directly anymore!
| Property name | Default value | Description |
|---|---|---|
| wildfly_SERVER_SSL_KEYSTORE | /var/opt/neviskeybox/default/default/node_keystore.jks | Path to the Java keystore. Any Java keystore is supported. |
| wildfly_SERVER_SSL_KEYSTORE_PASSWORD | password | Keystore password.To avoid plain text passwords in the configuration file, store them in nevisCred. |
| wildfly_SERVER_SSL_KEY_ALIAS | node | Alias for where the node certificate (used for HTTPS) is stored in the keystore. |
| nevis.ninja.signerCertificate | Disabled by default | When disabled, the logins are directly managed by JRS without single sign-on (SSO) or a nevisProxy integration.If enabled, this setting defines the path to the Java trustStore for the Ninja Signer Certificate. nevisReports needs to know this information for end users that log in with single sign-on (SSO) via nevisProxy.The file must be readable for usernvbuser. See Configuring nevisProxy to protect JRS for more information. Recommended value:/var/opt/neviskeybox/default/nevis/auth_keystore.jks |
| wildfly_VMARGS_SSL_TRUSTSTORE | ${JAVA_HOME}/jre/lib/security/cacerts | Path to the Java truststore. |
| wildfly_VMARGS_SSL_TRUSTSTORE_PASSWORD | Empty by default | Truststore password. |
nevisReports properties
Optionally, you can set additional properties. The next table lists nevisReports-specific properties. See the configuration file itself for additional information.
| Property name | Default value | Description |
|---|---|---|
| nevis.reports.include-standard-catalogs | ** | All report catalogs are included by default. See Deployment packaging for information about the catalog system. |
| nevis.reports.jrs-export-formats | pdf html csv docx xlsx xlsxNoPag | Sets the export formats that are visible in the report viewer menu (not the scheduler). |
| nevis.reports.jrs-session-timeout | 125 | Sets the web application session time-out in minutes. |
nevisReports does not support changes to the other JRS-specific properties in the file.
nevisIDM connection properties
The following table lists properties to configure the database connection for nevisIDM.
| Property name | Default value | Description |
|---|---|---|
| nevis_reports_nevisidm_jdbc_connection_string | jdbc:mariadb://... | Defines the JDBC connection URL. |
| nevis_reports_nevisidm_db_user | dbusername | Defines the JDBC datausername name.Create a read-only user for the nevisIDM database. |
| nevis_reports_nevisidm_db_password | password | Defines the JDBC database password.To avoid a plain text password in this property file, store them in nevisCred. |
| nevis_reports_nevisidm_rest_hostname_port | Disabled by default | Hostname and port for direct access to nevisIDM along with the protocol (HTTP/HTTPS). Use this property to make REST calls from the nevisReport server to nevisIDM.Example: https://nevisidm-server.company.com:8989/ |
Report properties
The following table lists properties to configure standard reports that come out of the box with nevisReports.
| Property name | Default value | Description |
|---|---|---|
| nevis_reports_risk_level_threshold | 3 | Used for the [Elevated Authorizations] report. This property defines the risk level threshold of a role. |
| nevis_reports_risk_level_property_name | RiskLevel | Used for the [Elevated Authorizations] report. This property defines the property name to indicate the risk level of a role. |
| nevis_reports_role_count_threshold | 5 | Used for the [Accumulated Authorizations] report. This property defines the threshold count for roles held by a user. |
| nevis_reports_dormant_threshold | 180 | Defines after how many days an account or authorisation is counted as dormant. |
| nevisreports_sectoken_authsigner**certificate | Disabled by default | Specifies the path to the Auth Signer certificate/public key (in .pem format) used for the SecToken generation on the nevisReports server. |
| nevisreports_sectoken_authsigner**keystore | Disabled by default | Specifies the path to the Auth Signer keystore/private key (in .jks format) used to sign the SecToken on the nevisReports server. |
| nevisreports_sectoken_keystore**passphrase | Disabled by default | Defines the passphrase used to decrypt the Auth Signer keystore (specified with the property nevis_reports_sectoken_authsigner_keystore). The property supports passphrase getters like file://<path> and pipe://<command>, along with regular plain text passphrases. |
| nevis_reports_sectoken_userid | Disabled by default | Specifies the nevisIDM user ID of the user whose ID is propagated with the SecToken. This should be a techuser who has the access rights necessary to make REST calls to nevisIDM. |
| nevis_reports_sectoken_profileid | Disabled by default | Specifies the nevisIDM profile ID of the user whose user ID is set in the property nevis_reports_sectoken_userid. The profile ID is propagated with the SecToken. |
| nevisreports_billing**pricingScriptPath | Disabled by default | Sets the path to a groovy script to enable price calculations in the [Usage and Billing] report.We recommend placing the custom scripts in the /var/opt/nevisreports/jrs/conf directory and making the directory readable by the nevisReports process.This property is commented out by default. To enable the price calculation script, uncomment the property. |
| nevis_reports_billing_rateRequest | 0.01 | Defines the billing rate per request. |
| nevis.reports.billing.currency | CHF | Defines the currency label (such as "CHF", "EUR" or "USD") displayed in the report.Note that the system does not check the currency label. That is, if you enter an invalid currency label, it is shown in the report just like that. |
Server installation
To install the server component, run the nevisreports handover command. Reference the configuration file you adapted in the previous steps (nevisreports.properties):
JAVA_HOME=<put-your-path>
export JAVA_HOME
nevisreports handover /tmp/nevisreports.properties
Be sure to set the JAVA_HOME variable with the correct JDK path, before running the nevisreports commands. Never set the JAVA_HOME variable with a JRE path.
Executing the handover command can take up to 15 minutes to complete. During that time [Configuring event logging] can be done in parallel on the sending hosts.
After handover has completed, the system stores a copy of the properties file in /var/opt/nevisreports/jrs/conf/nevisreports.properties. The system will use this file when running the nevisReports administration commands, such as updating the catalogs containing the report definitions, various datasource URI, etc. Note that this file is not used by the JRS application running within WildFly.
Hardening
Secure the JRS server for production setups. To this end:
- Delete default anonymousUser and testuser accounts.
- Set random passwords for the superuser and jasperadmin:
nevisreports secure
The new passwords for the superuser and jasperadmin will be printed on the console or updated automatically in nevisreports.properties or nevisCred.
JNDI resource configuration
This chapter explains how to configure additional JNDI/JDBC data sources that can be used as a source for custom reports. A default configuration for nevisIDM is created during handover.
Reports get their data from various predefined JRS data source "hooks". nevisReports comes with the following standard data source definitions, which you can find in the JRS repository path <organization_root>/datasources. nevisReports uses these data sources for standard reports and may also use them for custom reports. The following table lists the standard definitions.
| JRS data source | JNDI resource | Description | SQL/REST |
|---|---|---|---|
| NEV_DATASRC_LOCAL_ES | - | Connectivity to the locally bundled Elasticsearch database on the nevisReports appliance. You can use this data source without additional setup. | Elasticsearch REST API |
| NEV_DATASRC_IDM_REST | - | Connectivity to nevisIDM (direct connection) to consume REST APIs exposed by nevisIDM.This source is automatically configured during handover if the property nevis_reports_nevisidm_rest_hostname_port is defined. You find this property in the nevisreports.properties file. | nevisIDM REST API |
| NEV_DATASRC_IDM | jdbc/nevisidm | Connectivity to the nevisIDM database. The database server must be configured to allow remote connections.To enable reports to query nevisIDM data, set up a connection pool resource in the Java container with the name jdbc/nevisidm.This source is automatically configured during handover if the correct *nevisreports_idm** properties are defined. | SQL |
| NEV_DATASRC_WF | jdbc/neviswf | Connectivity to the nevisWorkflow database.To enable reports to query nevisWorkflow data, set up a connection pool resource in the Java container with the name jdbc/neviswf.(There are no standard reports that consume data from this data source as of nevisReports ) | SQL |
| NEV_DATASRC_DP | jdbc/nevisdp | Connectivity to a nevisDataPorter database with logged nevisDataPorter actions. To enable reports to query nevisDataPorter data, set up a connection pool resource in the Java container with the name jdbc/nevisdp.(There are no standard reports that consume data from this data source as ofnevisReports) | SQL |
Configure the above JNDI resources as follows. Note that nevisProxy- and nevisAuth-based reports get their data from Elasticsearch running on localhost. The following applies only to SQL-based reports.
- Create the directory /var/opt/nevisreports/jrs/conf/data-sources after running the command nevisreports handover (see the previous section).
- In the data-sources directory, create a file that ends with -ds.xml (e.g., nevisWF-ds.xml) and configure JDBC resources using an existing template, depending on the database type. Replace all variables (e.g., @DBNAME@, @USERNAME@) in the resulting file with the database credentials. See alternative example data source below.
cp /opt/nevisreports/jrs/templates/nevisIDM-ds.xml /var/opt/nevisreports/jrs/conf/data-sources/yourNew-ds.xml
vi /var/opt/nevisreports/jrs/conf/data-sources/yourNew-ds.xml
- After you created -ds.xml, run the following command. Note: This action restarts the container.
nevisreports deploy-data-sources
Configuration changes
If nevisIDM-{type}-ds.xml already exists in /var/opt/nevisreports any changes applied to nevisreports.properties have no impact when running the nevisreports deploy-data-sources command.
Securing JDBC data sources
When you configure the JDBC connection to databases, ensure that read-only user accounts are created because nevisReports requires read access to all views and tables.
Contact your DBA or follow the database documentation on how to create and provision read-only access user accounts for the appropriate databases.
nevisIDM Access
Note that out of the two standard nevisIDM users (DBOWNER and DBUSER), only the DBOWNER by default has access to all the tables and views that nevisReports requires.
Example *-ds.xml files
If you want to set up connections to more than one database, you can configure all of them in a single configuration file.
/var/opt/nevisreports/jrs/conf/data-sources/nevisIDM-oracle-ds.xml
<?xml version="1.0" encoding="UTF-8"?>
<datasources>
 <!--
 Set DBHOST, DBPORT, DBNAME, USERNAME, PASSWORD with actual values.
 Set JNDINAME corresponding to the nevis component, e.g: "jdbc/nevisidm"
 -->
 <datasource jta="false" jndi-name="java:/jdbc/@JNDINAME@" pool-name="@JNDINAME@_pool" enabled="true" use-ccm="false">

 <driver>ojdbc6-0.0.jar</driver>
 <security>
 <user-name>@USERNAME@</user-name>
 <password>@PASSWORD@</password>
 </security>
 <pool>
 <min-pool-size>5</min-pool-size>
 <max-pool-size>50</max-pool-size>
 <prefill>true</prefill>
 </pool>
 <validation>
   <background-validation>true</background-validation>
   <background-validation-millis>180000</background-validation-millis>
 <check-valid-connection-sql>SELECT 1 FROM DUAL</check-valid-connection-sql>
 </validation>
 <statement>
 <share-prepared-statements>false</share-prepared-statements>
 </statement>
 </datasource>
</datasources>
/var/opt/nevisreports/jrs/conf/data-sources/nevisIDM-mysql-ds.xml
<?xml version="1.0" encoding="UTF-8"?>
<datasources>
 <!--
 Set DBHOST, DBPORT, DBNAME, USERNAME, PASSWORD with actual values.
 Set JNDINAME corresponding to the nevis component, e.g: "nevisidm"
 -->
 <datasource jta="false" jndi-name="java:/jdbc/@JNDINAME@" pool-name="@JNDINAME@_pool" enabled="true" use-ccm="false">

 <driver>mariadb-java-client-0.0.jar</driver>
 <security>
 <user-name>@USERNAME@</user-name>
 <password>@PASSWORD@</password>
 </security>
 <pool>
 <min-pool-size>5</min-pool-size>
 <max-pool-size>50</max-pool-size>
 <prefill>true</prefill>
 </pool>
 <validation>
   <background-validation>true</background-validation>
   <background-validation-millis>180000</background-validation-millis>
 <check-valid-connection-sql>SELECT 1</check-valid-connection-sql>
 </validation>
 <statement>
 <share-prepared-statements>false</share-prepared-statements>
 </statement>
 </datasource>
</datasources>
Configuring manually
Besides installing the three nevisReports components with the default handovercommand described in the above sections, it is possible to control and manage the installation flow manually. This chapter describes such a manual installation procedure for each of the three nevisReports components.
Use this approach if you need more control of the installation flow. It allows you to make extra configurations that are not part of the standard handover installation.
Configuring nevisreports-es manually
This section explains how to install and configure Elasticsearch manually.
The installation of Elasticsearch by means of the default handover command is described in [Configuring Elasticsearch].
The nevisreports-es script is an admin script containing a list of targets. Each target performs a specific task. All targets together perform a complete nevisreports-es instance creation and configuration.
To successfully install nevisreports-es, it is necessary to execute a specific set of targets in a certain order. The manual configuration procedure follows the next sequence:
- Instance creation (required)
- Deployment of the Elasticsearch scripts (required)
- Start of the nevisreports-esservice (required)
The installation consists of a) instance creation and b) deployment of dependent components and configuration files ("post instance creation activities"). The instance creation must be executed before any other deployment related task. Proceed as follows:
- Set the JAVA_HOME path:
JAVA_HOME=<put-your-path>
export JAVA_HOME
Be sure to set the JAVA_HOME variable with the correct JDK path, before running the nevisreports-es commands. Never set the JAVA_HOME variable with a JRE path. 2. Create a default instance of nevisreports-es with the following command:
nevisreports-es inst create
- Enable the nevisreports-essystem service, with the following command:
systemctl enable nevisreports-es
- Start the service by running the following command:
systemctl start nevisreports-es
- Deploy the Elasticsearch search template scripts from /opt to /var/opt by running the following command:
nevisreports-es deploy-installed-es-scripts
- To display the status of the service, run the following command:
systemctl status nevisreports-es
- To view a complete log, use the following command:
journalctl -u nevisreports-es
Configuring nevisreports-ls manually
This section explains how to install and configure Logstash manually.
The installation of Logstash by means of the default handover command is described in [Configuring Logstash].
The nevisreports-ls script is an admin script containing a list of targets. Each target performs a specific task. All targets together perform a complete nevisreports-ls instance creation and configuration.
To successfully install nevisreports-ls, it is necessary to execute a specific set of targets in a certain order. The manual configuration procedure follows the next sequence:
- Instance creation (required)
- Deployment of the Logstash configuration (required)
- Start of the events services (required)
The installation consists of a) instance creation and b) deployment of dependent components and configuration files ("post instance creation activities"). The instance creation must be executed before any other deployment related task. Proceed as follows:
- Set the JAVA_HOME path:
JAVA_HOME=<put-your-path>
export JAVA_HOME
Be sure to set the JAVA_HOME variable with the correct JDK path, before running the nevisreports-ls commands. Never set the JAVA_HOME variable with a JRE path. 2. Create a default instance of nevisreports-ls, with the following command:
nevisreports-ls inst create /tmp/nevisreports-ls.properties
- Deploy the Logstash configurations files and scripts from /opt to /var/opt, by running the following command:
nevisreports-ls deploy-logstash-configs
- Enable the events system services with the following command:
systemctl enable nevisreports-ls@events
- Start the events services by executing the following command:
systemctl start nevisreports-ls@events
- To display the status of the events services, run the following command:
systemctl status nevisreports-ls@events
- To view the complete logs of the events services, run the following command:
journalctl -u nevisreports-ls@events
Configuring nevisreports manually
Prerequisites
Before you proceed with the installation, check that all dependent components are up and running (we assume that the components are already installed and configured):
- The Elasticsearch server should be up and running ").
- The repository database connection details should be correct ").
- HTTPS node certificates: A self-signed certificate should be generated prior to the installation, by using the nevisKeybox ").
- A nevisCred instance should be created prior to the nevisReports installation. Secure all the required passwords in nevisCred ").
- Prepare a nevisReports property file in /tmp/nevisreports.properties with all the required configuration data. See the corresponding "Properties" sections of Jasper, WildFly, Logstash and nevisReports in Configuring JasperReports Server.
To verify the status of the dependent components (Elasticsearch, nevisKeybox and nevisCred) follow the instructions below or have a look at the corresponding reference guides.
- Check that Elasticsearch and Logstash are running:
systemctl status nevisreports-ls@events
systemctl status nevisreports-es
- Check the installed certificates in nevisKeybox, verify whether the required slot and cert files are created, check the HTTPS node certificates:
neviskeybox list -all # Look for presence of the "default / node" keystore and truststore
- Check the status of nevisCred, ensure that the service is running
neviscred status
Manual configuration
The nevisreports script is an admin script containing a list of targets. Each target performs a specific task. All targets together perform a complete nevisReports instance creation and configuration.
To successfully install nevisReports, it is necessary to execute a specific set of targets in a specific order. The manual configuration procedure follows a certain sequence (see the next list of targets). If you do not need a target, you can skip it.
- Instance creation (required)
- JRS repository creation (required)
- Deployment of the web application
- Deployment of the catalogs
- Deployment of the nevisIDM data source (and other databases)
- Deployment of the Ninja configuration
- Starting of the instance
- Creation of the test user
The installation consists of a) instance creation and b) deployment of dependent components and configuration files ("post instance creation activities"). The instance creation must be executed before any other deployment related task. Proceed as follows:
- Set the JAVA_HOME path:
JAVA_HOME=<put-your-path>
export JAVA_HOME
Be sure to set the JAVA_HOME variable with the correct JDK path, before running the nevisreports commands. Never set the JAVA_HOME variable with a JRE path. 2. Create the nevisReports instance with a nevisreports.properties file, by running the command below.
See Configuring JasperReports Server for configuration options of the nevisreports.properties file.
nevisreports inst create jrs /tmp/nevisreports.properties
The inst create target of nevisReports' admin script executes the following series of subtasks:
Preparation of the required directory structure.
Creation of a jrs instance in an adnwildfly container.
The instance must be named jrs. Any other name is not accepted or supported!
- Create the JRS repository database by running the following command:
nevisreports create-repo-db
- Deploy the nevisreports web application, with the following command:
nevisreports deploy-webapp
- Deploy the JRS license, by executing the following command:
nevisreports deploy-jrs-license
- Copy your custom JasperReports catalog ZIP archives to /var/opt/nevisreports/jrs/jrs-catalogs.
- Deploy the JasperReports catalogs with thedeploy-installed-catalogs target (or command, see the code block below). This will update the local repository with the latest report definitions and supported data (like themes or reports) required for report generation.
nevisreports deploy-installed-catalogs
Based on the nevis.reports.include-standard-catalogs property, the target looks for matching catalogs in /var/opt/nevisreports/jrs-catalogs and /opt/nevisreports/jrs-catalogs (containing the nevisReports' standard reports and dashboard). 8. Copy custom data source connections for more details about how to configure custom data sources. 9. Run the deploy-data-sources target (command) to deploy all custom data sources:
nevisreports deploy-data-sources
If the nevisidm-{type}-ds.xml file is missing, the deploy-data-sources command automatically generates the configuration based on the nevisIDM database connection details added to nevisreports.properties. 10. To enable single sign-on (SSO) with nevisProxy and nevisAuth for the JasperReports Server application, deploy the configuration in applicationContext-externalAuth-sso-ninja.xml to the JRS' WEB-INF directory:
nevisreports deploy-ninja-configs
This command/target is only executed when the property nevis.ninja.signerCertificate is defined in nevisreports.properties. 11. Start and restart all affected services. The command/target below starts the JasperReports Server (jrs) instance. It also internally checks for any remaining preparation task to be done for nevisReports after the instance has been started. This phase is executed only during fresh installation or when the repository database was reset. In the preparation phase, the target creates a test user and provides access to the reports directory structure for users based on default user roles.
# Start the JasperReports Server application
nevisreports start

# Restart Elasticsearch instances
systemctl start nevisreports-es

# Restart Logstash Instances
systemctl start nevisreports-ls@events
- To create a test user, run the following command:
nevisreports create-test-user
Configuring standard reports
For some standard reports to function properly, additional configuration of other Nevis products and/or components is required. This chapter explains in detail how to configure each Nevis product/component for use with the standard reports provided by nevisReports.
It is assumed that nevisReports is already successfully installed and configured. The same goes for the standard reports.
Configuring billing calculation for Usage and Billing report
This section is not relevant if the Usage and Billing report is not used or if the report is used without billing.
The [Usage and Billing report] supports the use of custom scripts to calculate the price of a report line item. The current JasperReports fields, variables, and parameters are passed directly into the script and exposed. Because of this flexibility, you can create any kind of billing logic (in terms of used currency, pricing model, and so on).
The writing of a custom script requires knowledge of Groovy, a scripting language for the Java Platform.
The Groovy Language homepage (http://groovy-lang.org/) has a lot of resources related to learning the language, including books, presentations, and courses. See http://groovy-lang.org/learn.html/` for more information.
Scripting
The report contains a sample pricing model that can be activated by setting the following properties in the nevisreports.properties file:
Pricing Model properties
nevis_reports_billing_pricingScriptPath=/opt/nevisreports/templates/sample-pricing.groovy #Path to the sample pricing script provided by Nevis.
nevis_reports_billing_rateRequest=0.01 #Defaults to rate of 1000 requests
nevis.reports.billing.currency=CHF #Currency label displayed in the report. It is a simple display label, not an i18n currency identifier.
By default, the nevis.reports.billing.taxRate property is not part of the nevisreports.properties file. When generating the report and calculating the billing, the system uses a default tax rate of 5%. To set a user-required tax rate, add the nevis.reports.billing.taxRate property to the nevisreports.properties file and configure it according to your wishes.
The sample pricing is a (very) simplified form of the Amazon S3 Storage pricing. The formula in the block below describes this pricing model:
Price = (KBytesIn+KBytesOut) / (1024*1024) * rate-bandwidth + #Requests / 1000 * rate-request
Custom pricing
Proceed as follows if you want to use a custom pricing instead of the sample pricing for the Usage and Billing report:
- Implement a Groovy script using the provided sample pricing as an example. The Groovy script has access to all the columns in the report as well as to the report's configuration properties. If required, replace the sample pricing model by the pricing model you want to use. The script must return a value of type BigDecimal.
- Put the script in the conf directory of the relevant nevisReports instance (i.e.,
/var/opt/nevisreports/jrs/conf). Make sure the script is readable by the nevisReports process. - Configure the pricing model properties in the nevisreports.properties file according to your requirements. Make sure to set the correct path to the customized pricing script you want to use instead of the sample pricing script provided by Nevis.
Configuring nevisIDM REST API access
This section is relevant only if you use the [User Personal Data report].
nevisIDM exposes various kinds of REST APIs for consumption. The [User Personal Data report] depends on these REST APIs for the generation of the report. A valid SecToken is passed in the REST request from nevisReports to nevisIDM to authenticate the request call. These SecTokens are generated on the nevisReports machine and signed with a signer private key. nevisIDM on the other hand trusts the signer public key and hence verifies the SecToken passed in the request. Perform the following steps to configure the necessary setup:
- Creation of the signer key materialGenerate self-signed certificates (with nevisKeybox) on the nevisReports server:
####Example
PASSPHRASE=password neviskeybox selfcert -slot nevis -label authsigner-nevisidm -subject 'cn=authSignerNevisIDM@nevisreports-local, o=SIVEN AG, c=ch' -batch
PASSPHRASE=password neviskeybox access -slot nevis -label authsigner-nevisidm -group nvbgroup -user root -batch
PASSPHRASE=password neviskeybox passwd -keep -slot nevis -label authsigner-nevisidm -batch
- Import of the signer certificate to the nevisIDM ninja truststoreCopy the certificate (public key) that you generated in the previous step to the nevisIDM server. Then import it to the truststore of nevisIDM's ninja:
####Example
scp /var/opt/neviskeybox/default/nevis/authsigner-nevisidm_certificate.pem root@nevisidm-server:/tmp/
PASSPHRASE=password neviskeybox import -slot nevis -label authsigner-nevisidm -trust -file /tmp/authsigner-nevisidm_certificate.pem -batch
- Import of the CA certificate to the nevisReports truststore Import the certificate of the root CA to the truststore of nevisReports on the nevisReports server. You need the CA certificate to sign the nevisIDM certificate. Then specify the path of the truststore in the property wildfly_VMARGS_SSL_TRUSTSTORE (nevisreports.properties config file). If the truststore needs a password, specify this password in the property wildfly_VMARGS_SSL_TRUSTSTORE_PASSWORD. See the following sample code:
####Example
PASSPHRASE=password neviskeybox import -label node -trust -file /tmp/ca_cert.pem -batch
vim /var/opt/nevisreports/jrs/conf/nevisreports.properties
...
wildfly_VMARGS_SSL_TRUSTSTORE=/var/opt/neviskeybox/default/default/truststore.jks
- Creation of a tech user in nevisIDMTo be able to make REST calls to nevisIDM, nevisIDM must contain a tech user who holds the role SoapTechAccessReadOnly. See the nevisIDM reference guide for details on how to create such a tech user and how to assign the role SoapTechAccessReadOnlyto this user.
- Enabling the REST Query Service on nevisIDM To enable the REST Query Service on nevisIDM, open the nevisidm-prod.properties file of the nevisIDM instance and set the property queryService.enabled to "true".
- Restart of nevisIDMNow restart the nevisIDM server to reload all configuration and certificate changes you made in the previous steps.
- Specification of the nevisIDM REST hostname and port Specify the hostname and port for the nevisIDM REST call, in the property nevis_reports_nevisidm_rest_hostname_port (in the nevisreports.properties file).
####Example
nevis_reports_nevisidm_rest_hostname_port=https://nevisidm-server.company.com:8989/
Specification of the properties related to the SecToken generation To generate a SecToken on the nevisReports machine, specify the following properties in the nevisreports.properties file. Note that these are runtime properties.
nevis_reports_sectoken_authsigner_certificate: Specifies the path to the .pem format authsigner certificate/public key that you generated in [step 1].
nevis_reports_sectoken_authsigner_keystore: Specifies the path to the .jks format authsigner keystore/private key that you generated in [step 1].
nevis_reports_sectoken_keystore_passphrase: Specifies the passphrase used to decrypt the authsigned keystore that you set in [step 1]. This property also accepts the pipe:// expression, with which you can get the password by running a script/command.
nevis_reports_sectoken_userid : Specifies the user ID of the tech user who you generated in [step 4].
nevis_reports_sectoken_profileid : Speficies the profile ID of the tech user who you generated in [step 4].
####Example
nevis_reports_sectoken_authsigner_certificate=/var/opt/neviskeybox/default/nevis/authsigner-nevisidm_certificate.pem
nevis_reports_sectoken_authsigner_keystore=/var/opt/neviskeybox/default/nevis/authsigner-nevisidm_keystore.jks

nevis_reports_sectoken_keystore_passphrase=password
####Example to configure the above property using pipe:// using nevisCred ncclient
####nevis_reports_sectoken_keystore_passphrase=pipe:///opt/neviscred/bin/ncclient keybox.default.default.node

nevis_reports_sectoken_userid=1000
nevis_reports_sectoken_profileid=1000
If using the pipe:// command
Since nevisReports runs as nvbuser, the command in the expression pipe://<command> must have execute permission for the nvbuser.
9. Deployment of the catalogs and restart of the instance
Deploy the catalogs and restart the instance by running the following commands:
nevisreports deploy-installed-catalogs
nevisreports restart
If the property wildfly_VMARGS_SSL_TRUSTSTORE did not exist in the file nevisreports.properties before, execute the following command:
nevisreports redeploy
Configuring nevisIDM risk level property
This section is only relevant if you use the Elevated Authorizations report.
To be able to generate the [Elevated Authorizations report], you need to configure a custom property in nevisIDM. This pertains to the property that holds the risk level of a role. Roles with higher privileges and authorizations are considered to have a higher risk level. Since nevisIDM does not provide the concept of risk levels out of the box, extend the nevisIDM data model accordingly. This chapter explains how. For more detailed information, see nevisIDM refguide 4.3 Properties – customizing the nevisIDM data model.
Currently, you have to define the risk level property for each application separately.
nevisIDM includes the concept of property scopes. Each defined property must be assigned to a specific scope. Based on the scope, additional fields appear on entities like user, application or role. For the Elevated Authorizations report, add the risk level property to a role. The recommended scope is onRoleForApp.
For more information, see nevisIDM refguide 4.3.1. Property scopes.
Create a risk level property on an application
Chapter [Configuring JasperReports Server] explains the configuration needed on the nevisReports side. Here, we describe how to configure the nevisIDM part. Note that add the risk level property directly on the nevisIDM database. This requires access to the nevisIDM instance or database.
In case of an automatic configuration, use SQL commands to add the property directly on the database. Refer to the nevisIDM reference guide (chapter 4.3.1.6) for more details.
- Log in to the nevisIDM User Aministration application as a user with administration permissions.
- Open the application to which you want to add the risk level property. The property must be added to each application which roles should have a risk level rating applied.
- In the application's content area, go to the section Properties (at the bottom). Click on New to create a new property:
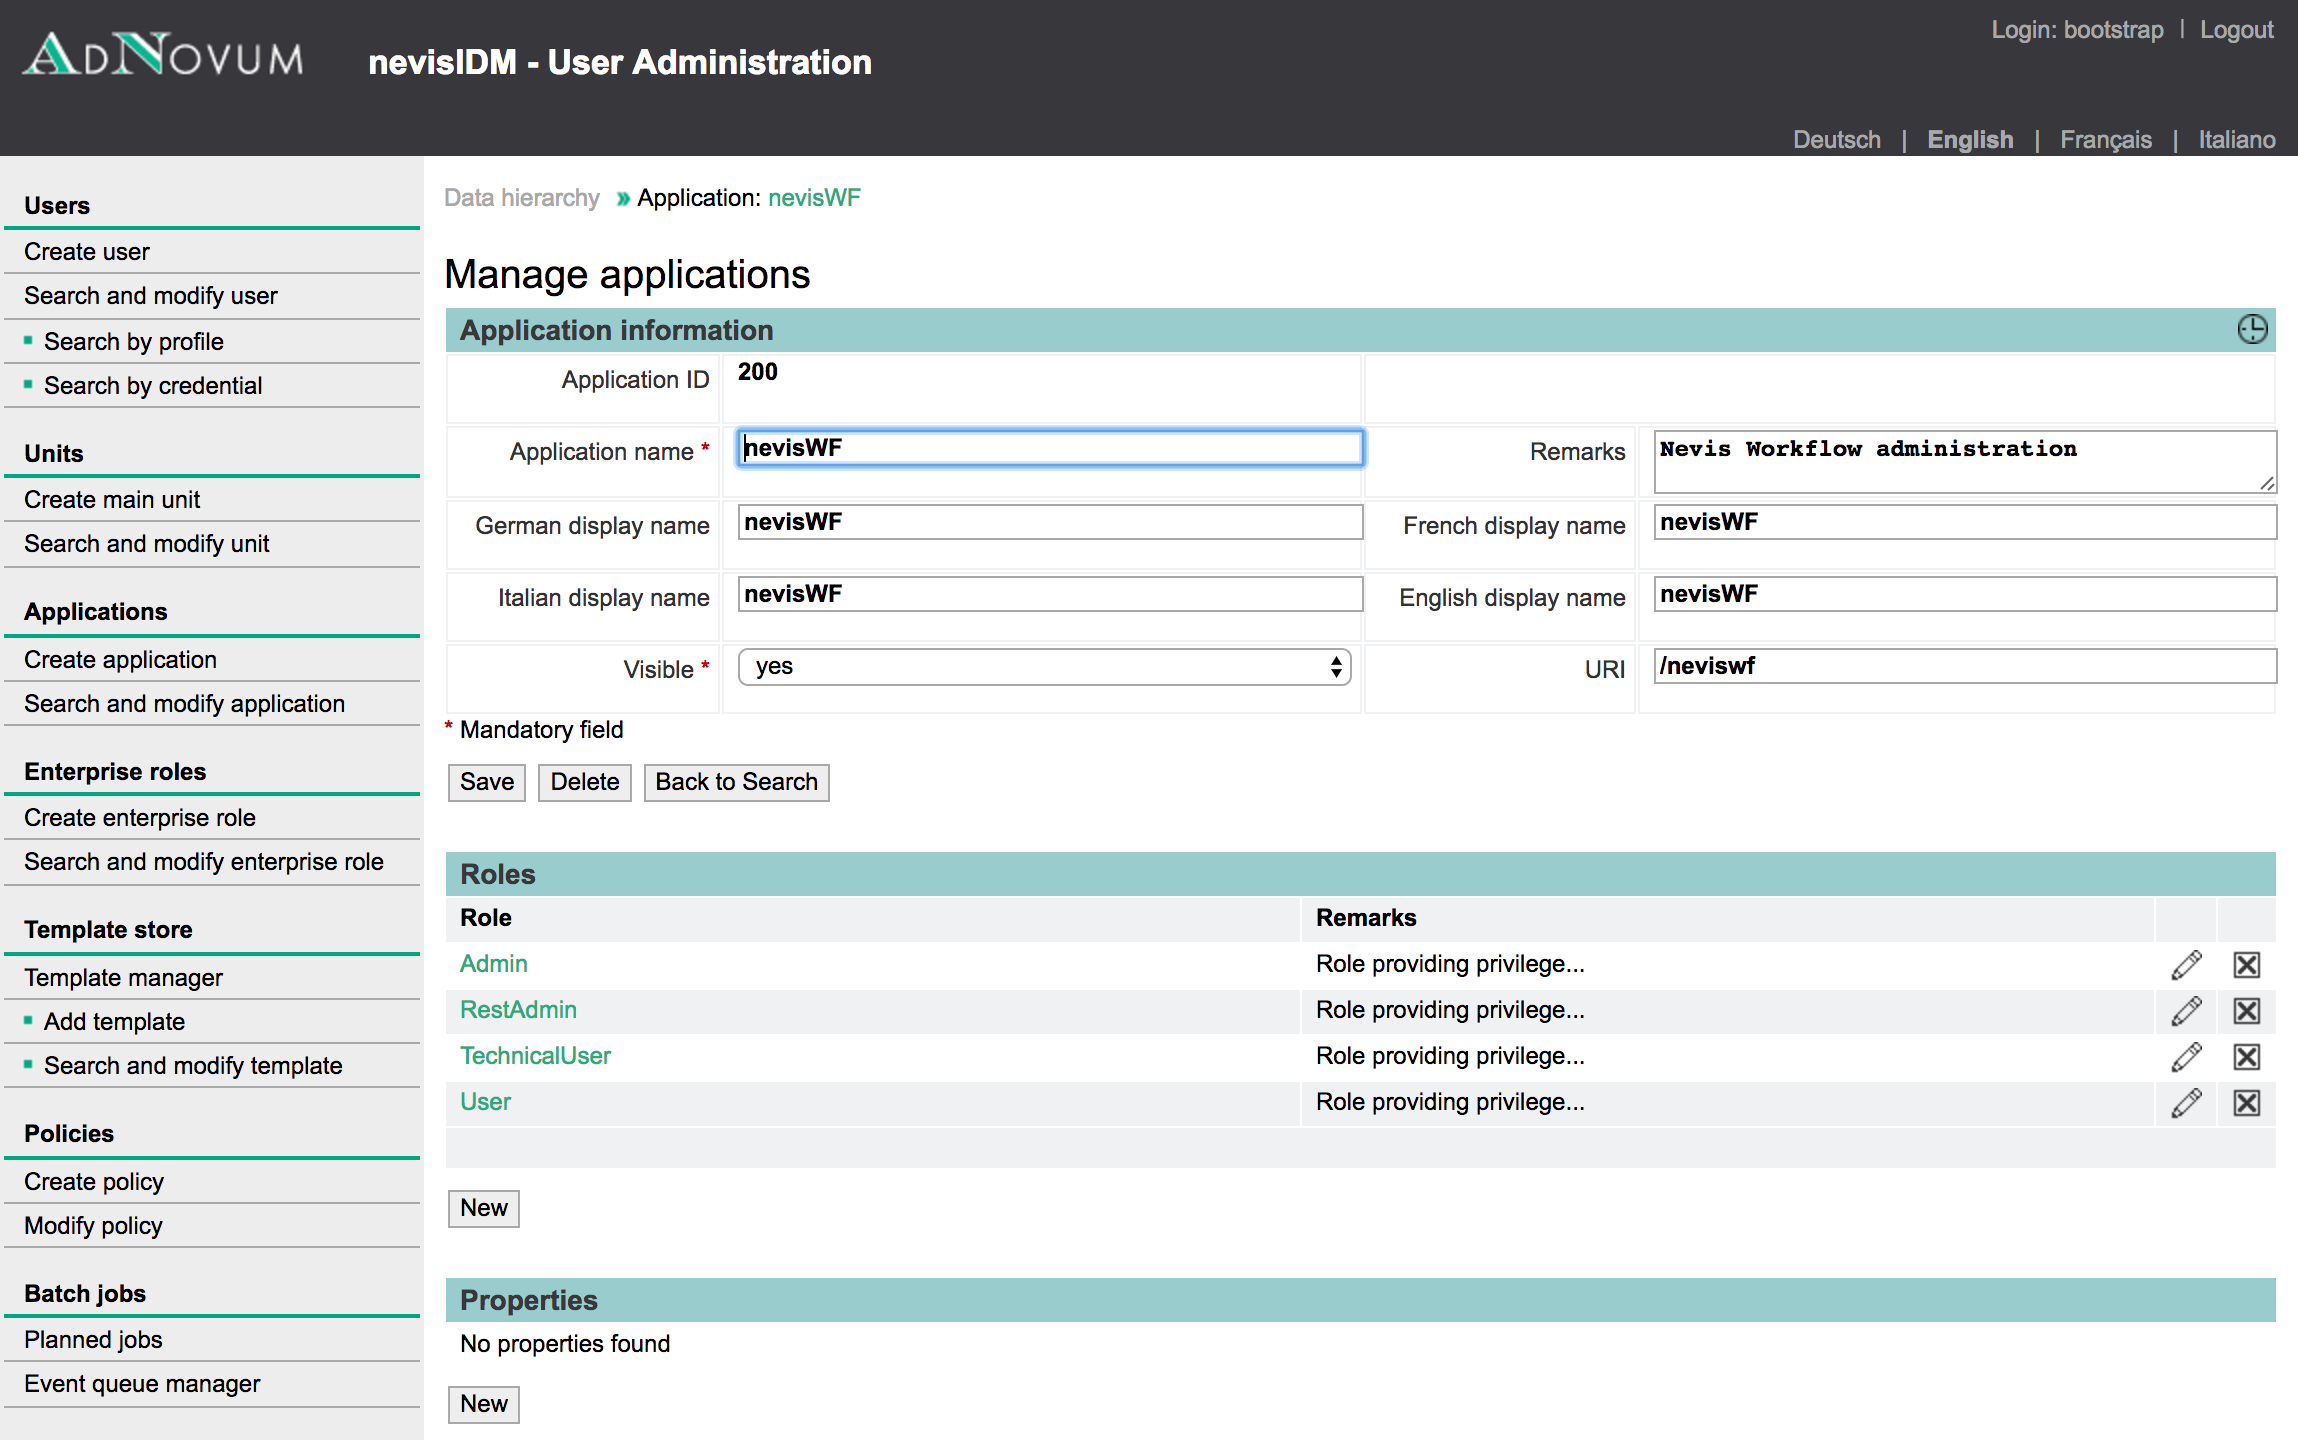
- The content area to manage properties appears:
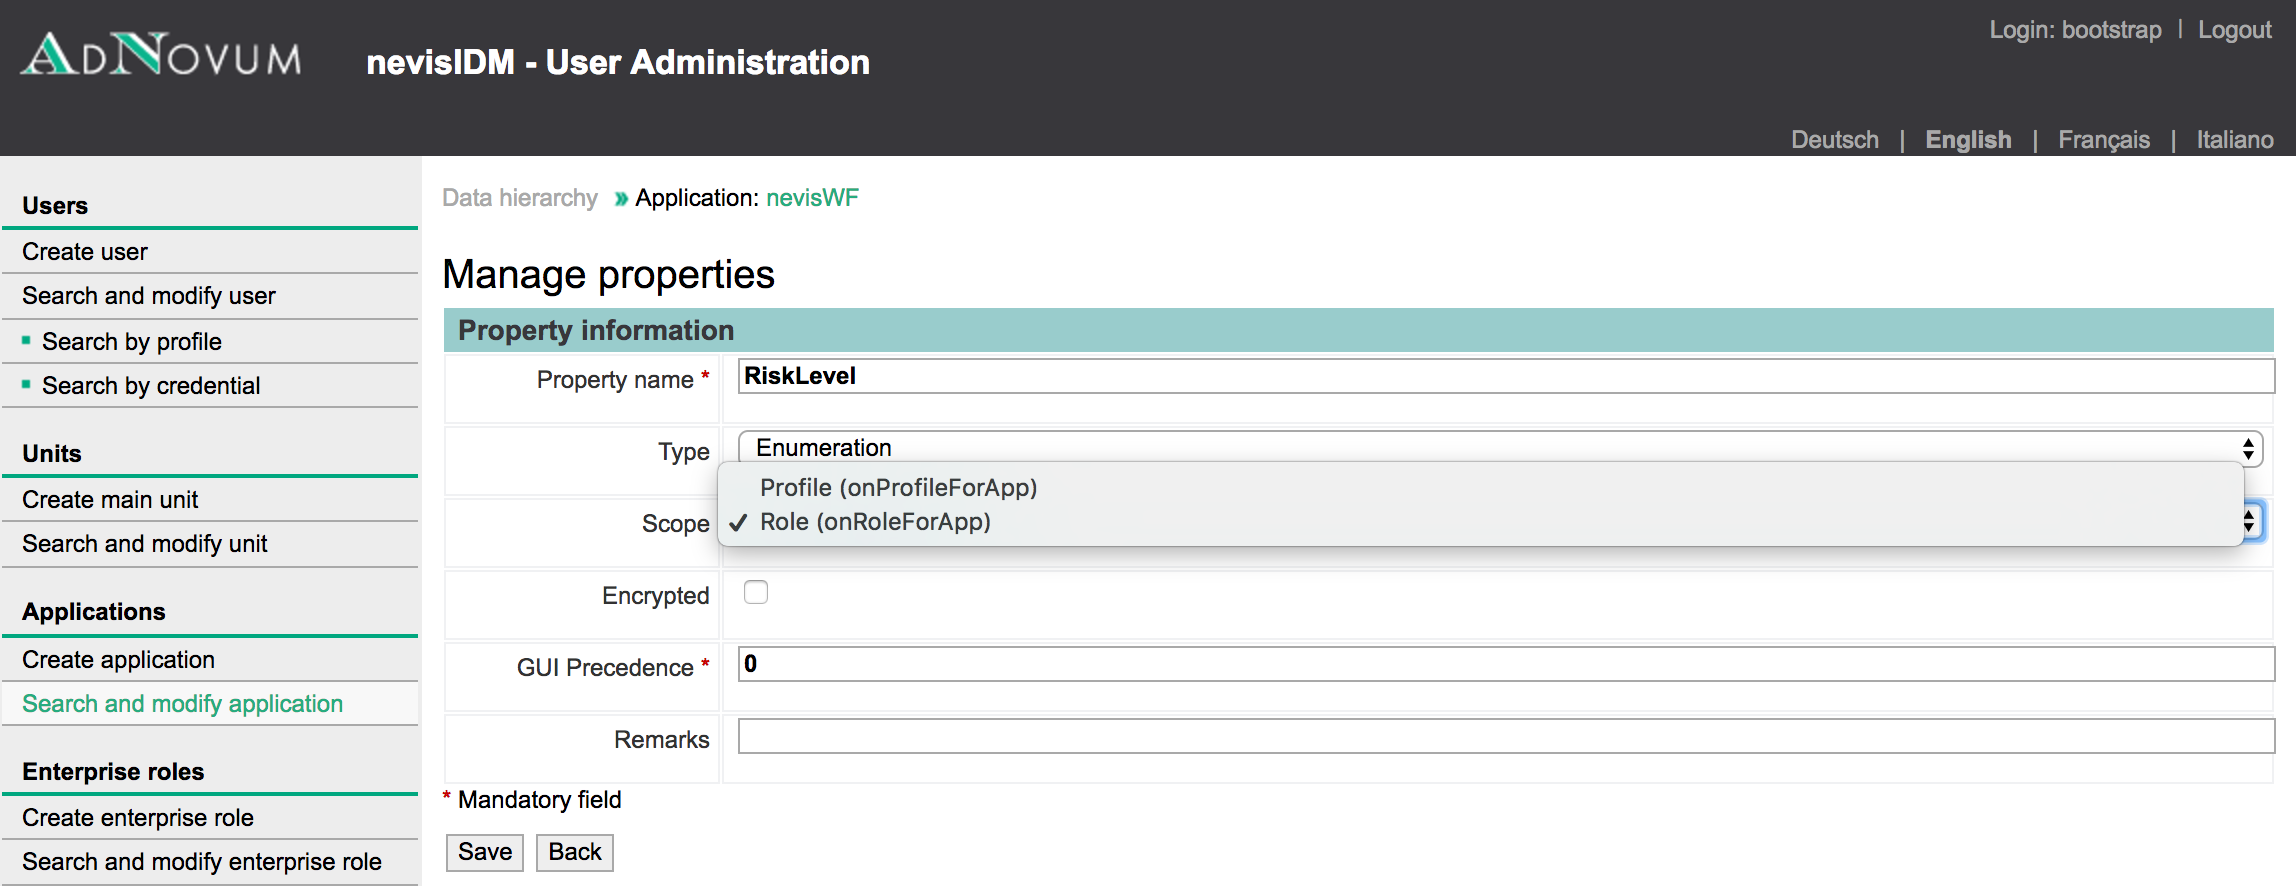
| Name | Value | Remark |
|---|---|---|
| Property name | RiskLevel | By default the value should be RiskLevel. If you want to use another property name, ensure to update the nevis_reports_risk_level_property_name setting in the nevisreports.properties accordingly. |
| Type | Enumeration | |
| Scope | Role (onRoleForApp) | (warning) |
| Encrypted | Unchecked | |
| GUI Precedence | 0 | |
| Remark | You can leave this section blank. |
- In the section List of values, add the risk level values 1, 2, 3, 4 and 5. Here 1 signifies no risk while 5 signifies highest risk:
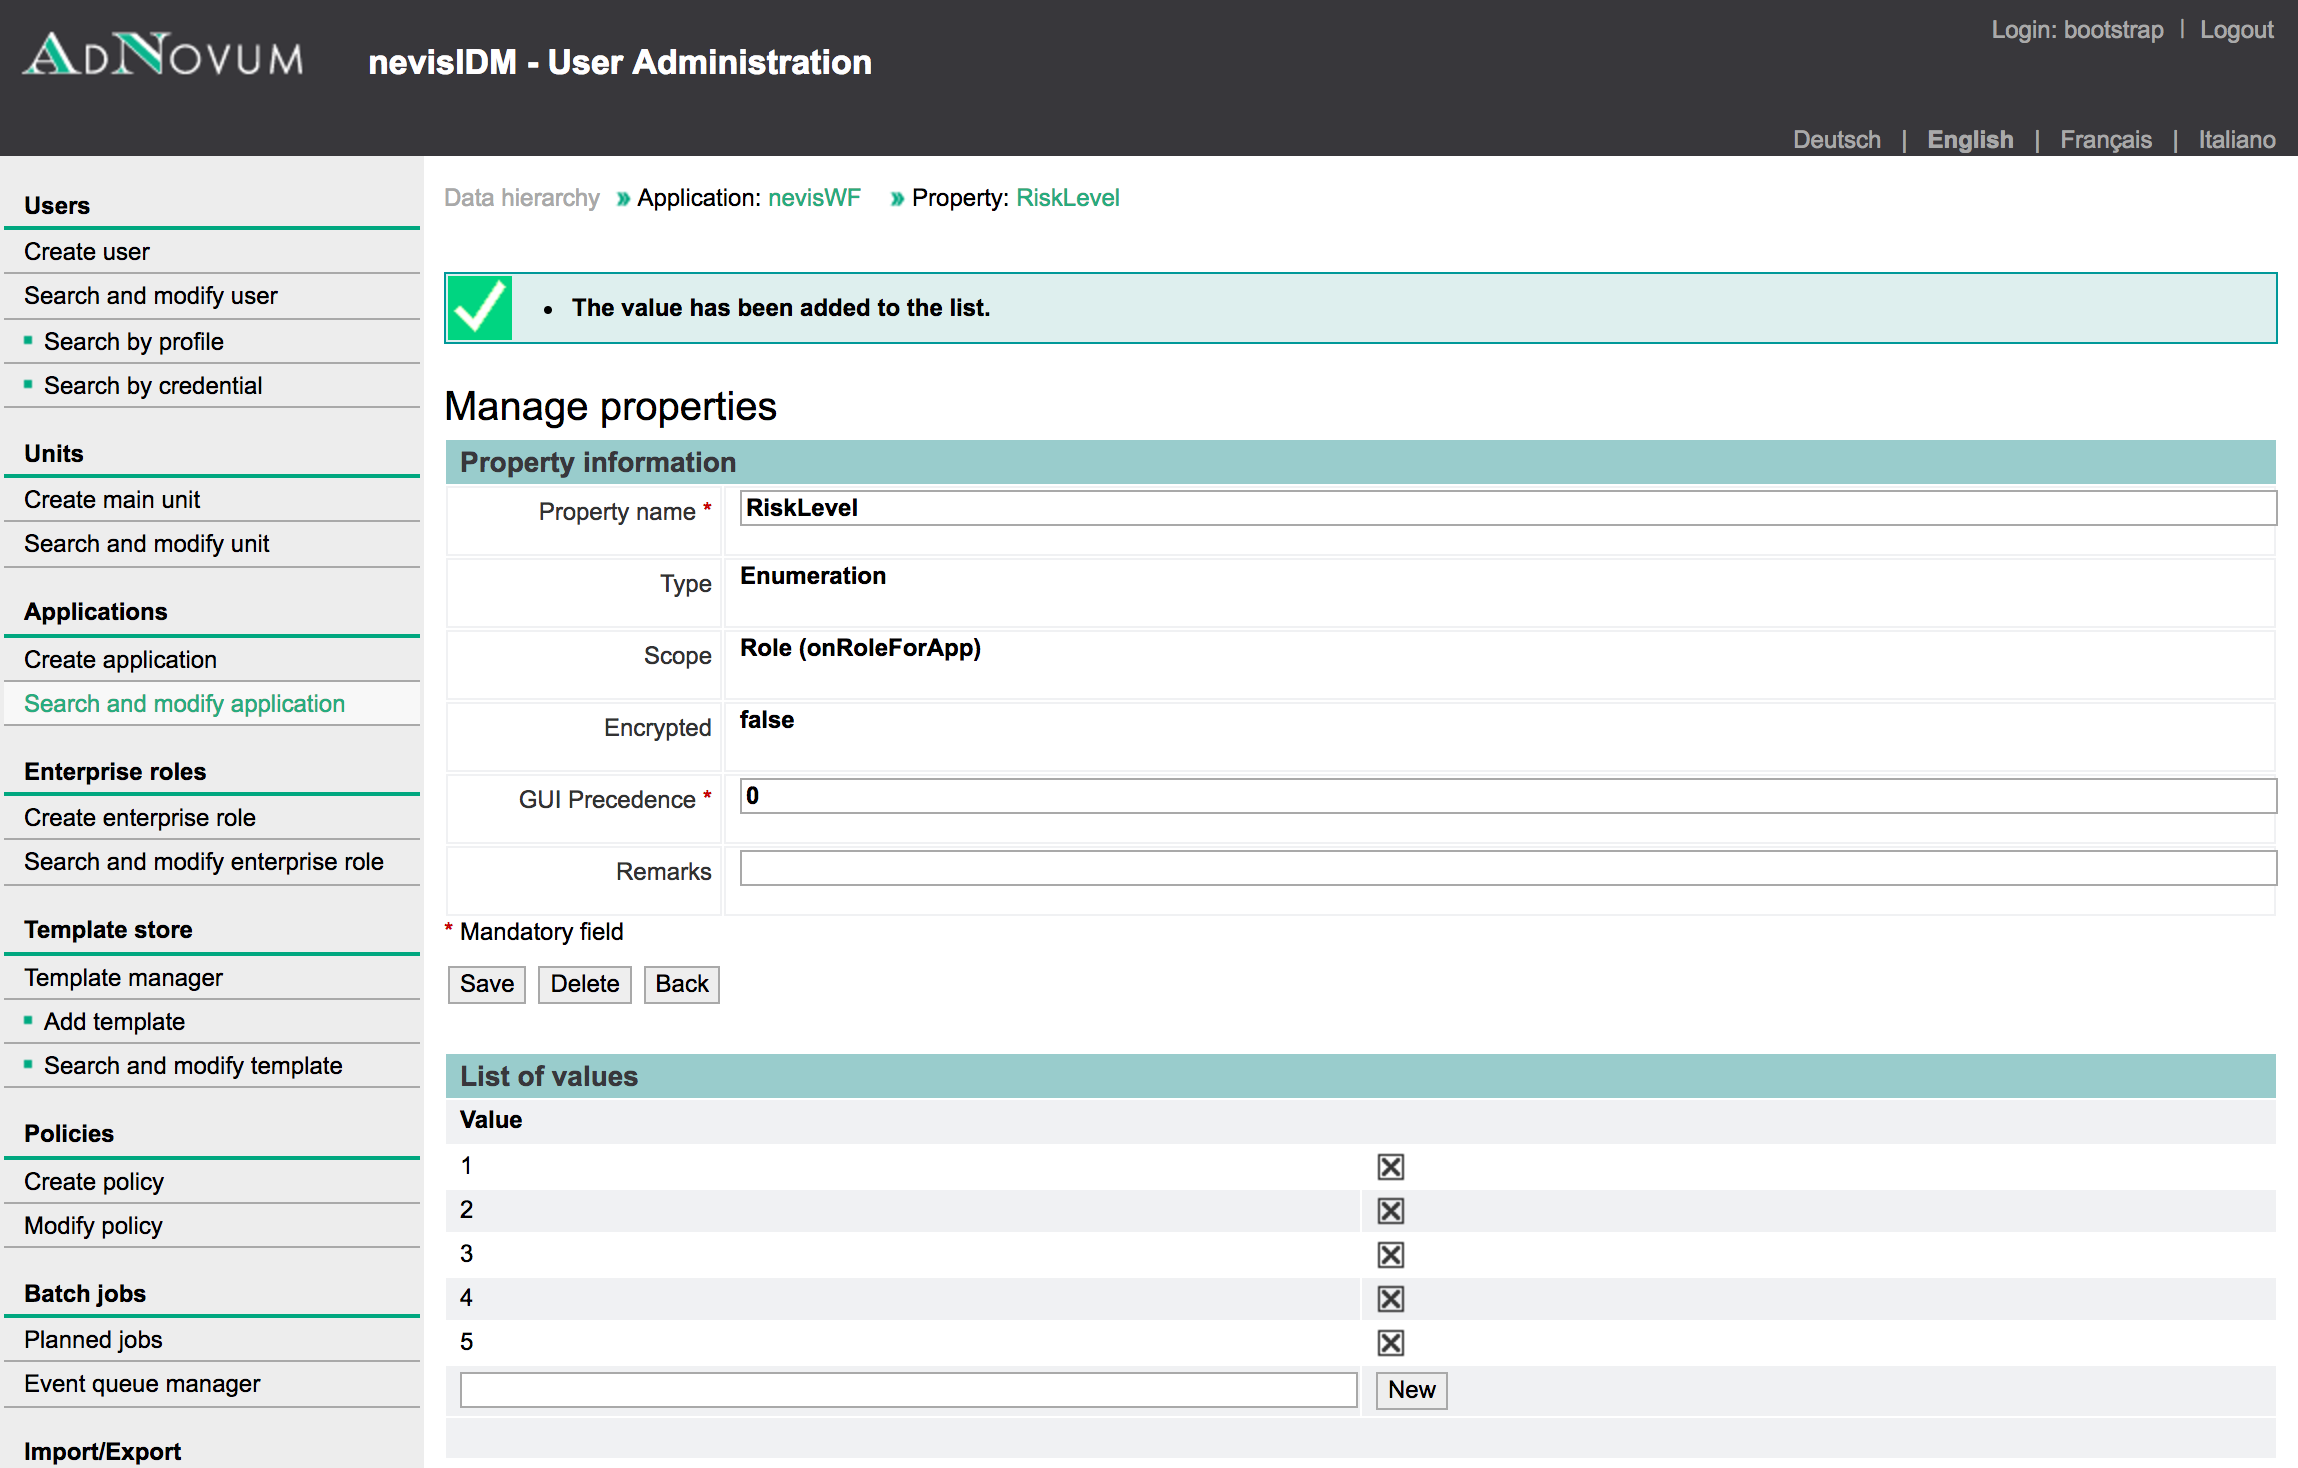
- All the roles belonging to the application now include the RiskLevel drop-down menu containing the five values added in the previous step (see the figure below).
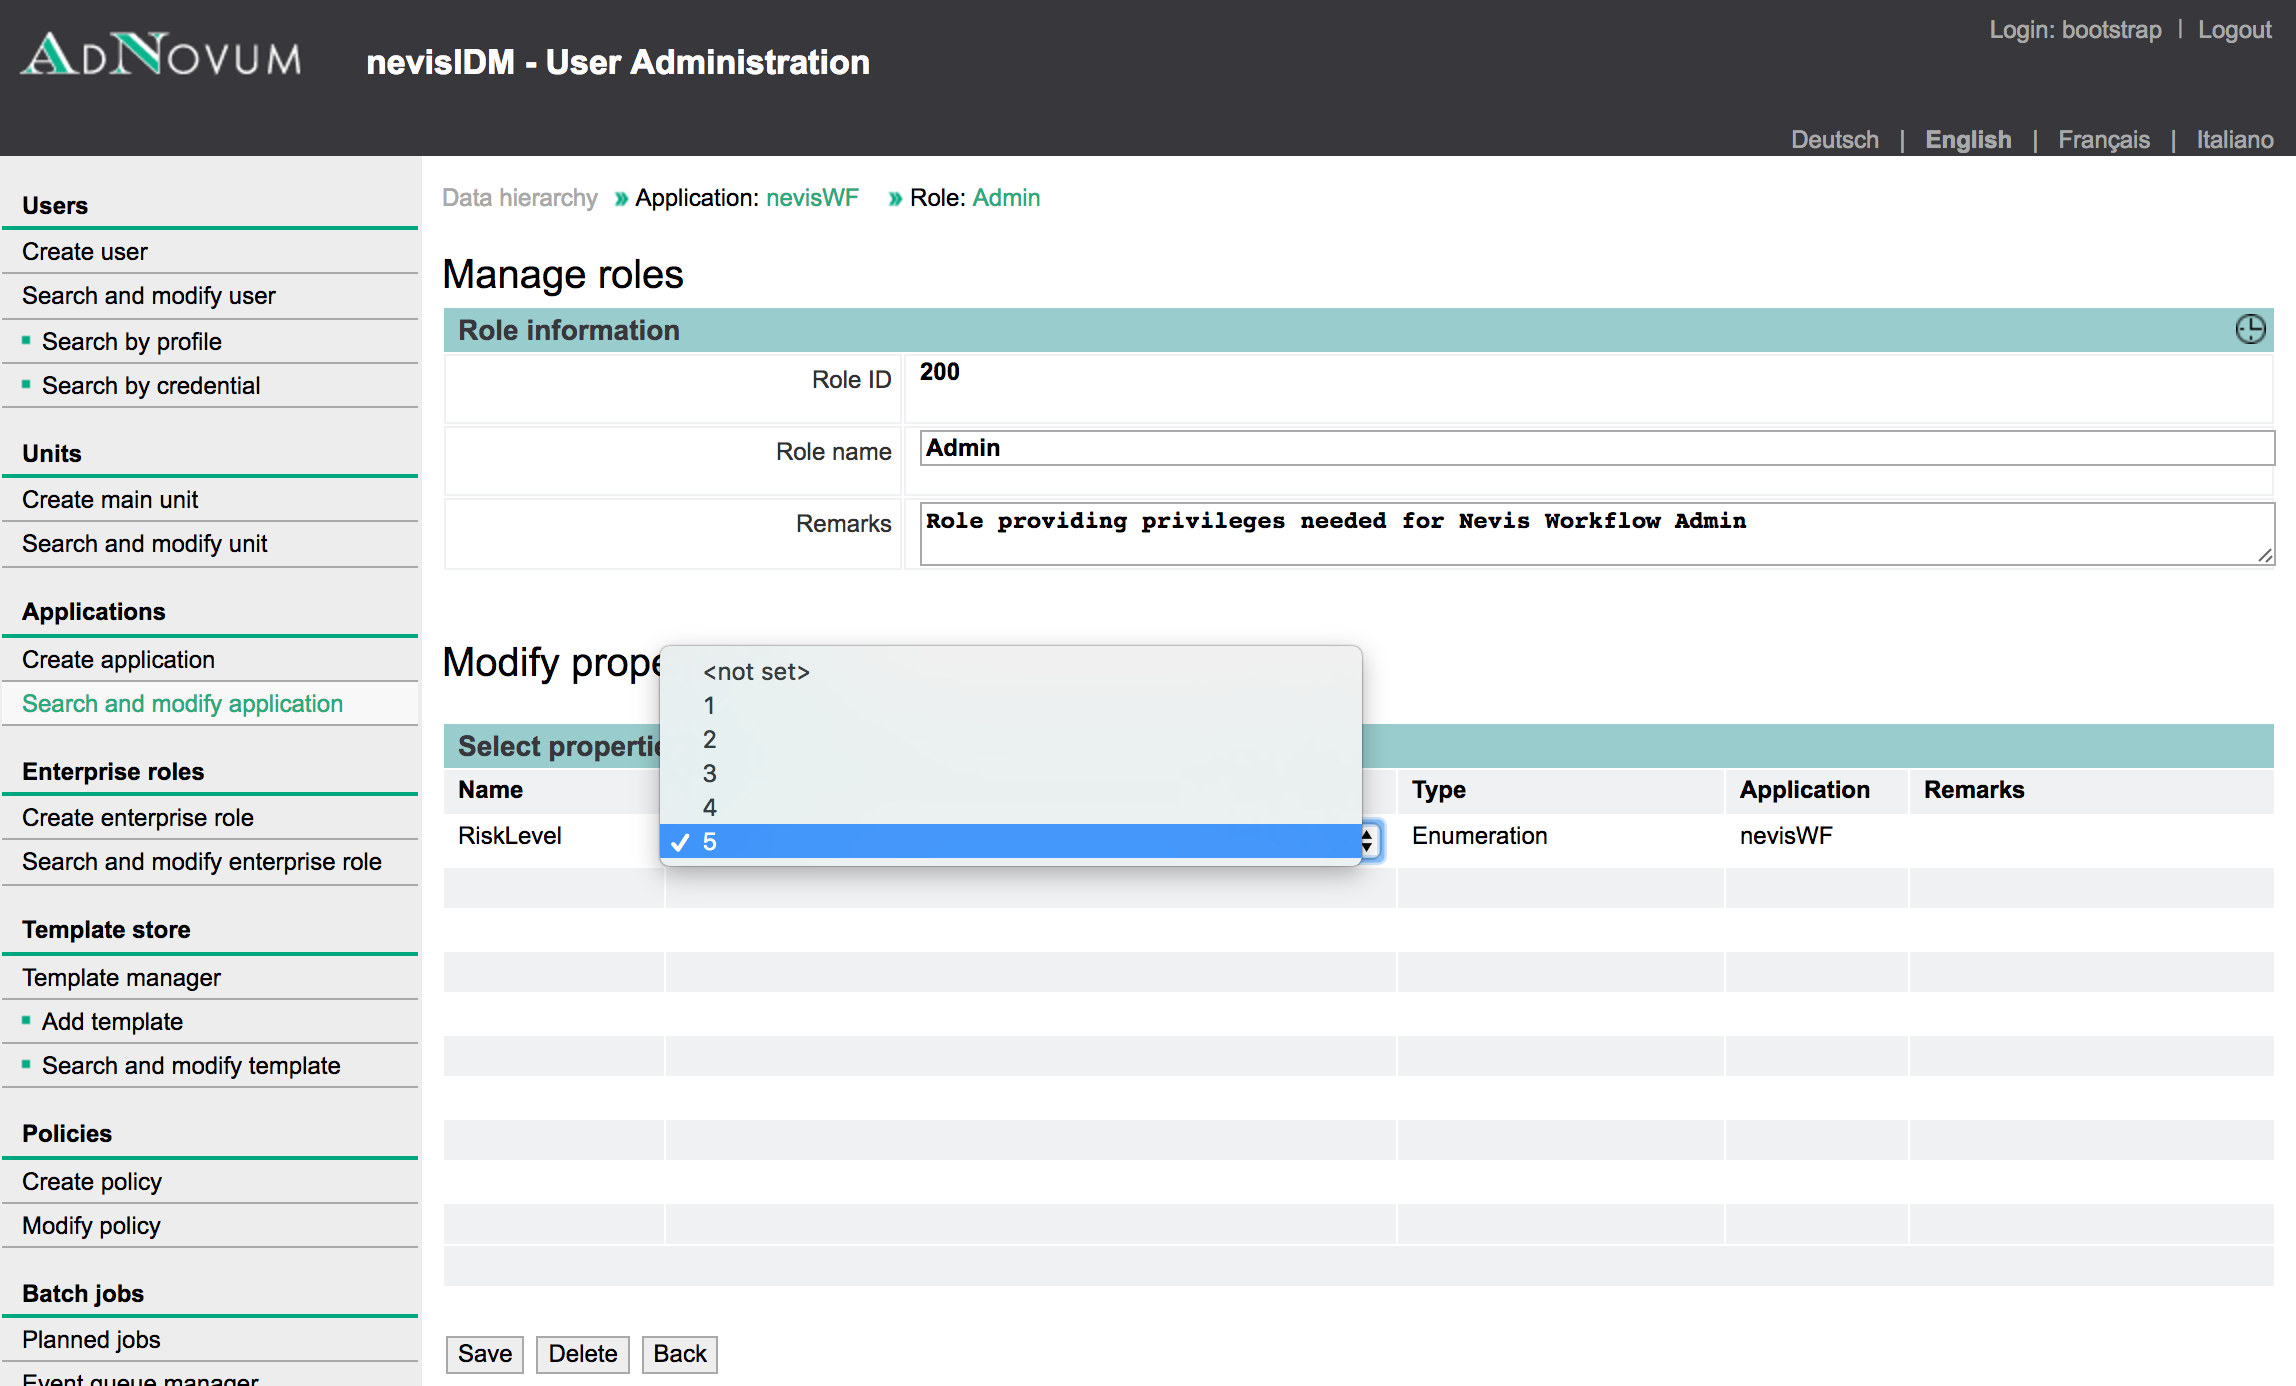
Creation and assignment of a risk level value is optional. Roles without a risk level are considered to have risk level 1 (low risk).
Suggested risk levels for nevisIDM roles
This section gives a suggestion for the risk levels of the roles in the nevisIDM application. The assigned risk levels are based on the following role hierarchy diagram from nevisIDM. As you can see, the risk level of the roles decreases from top to bottom.
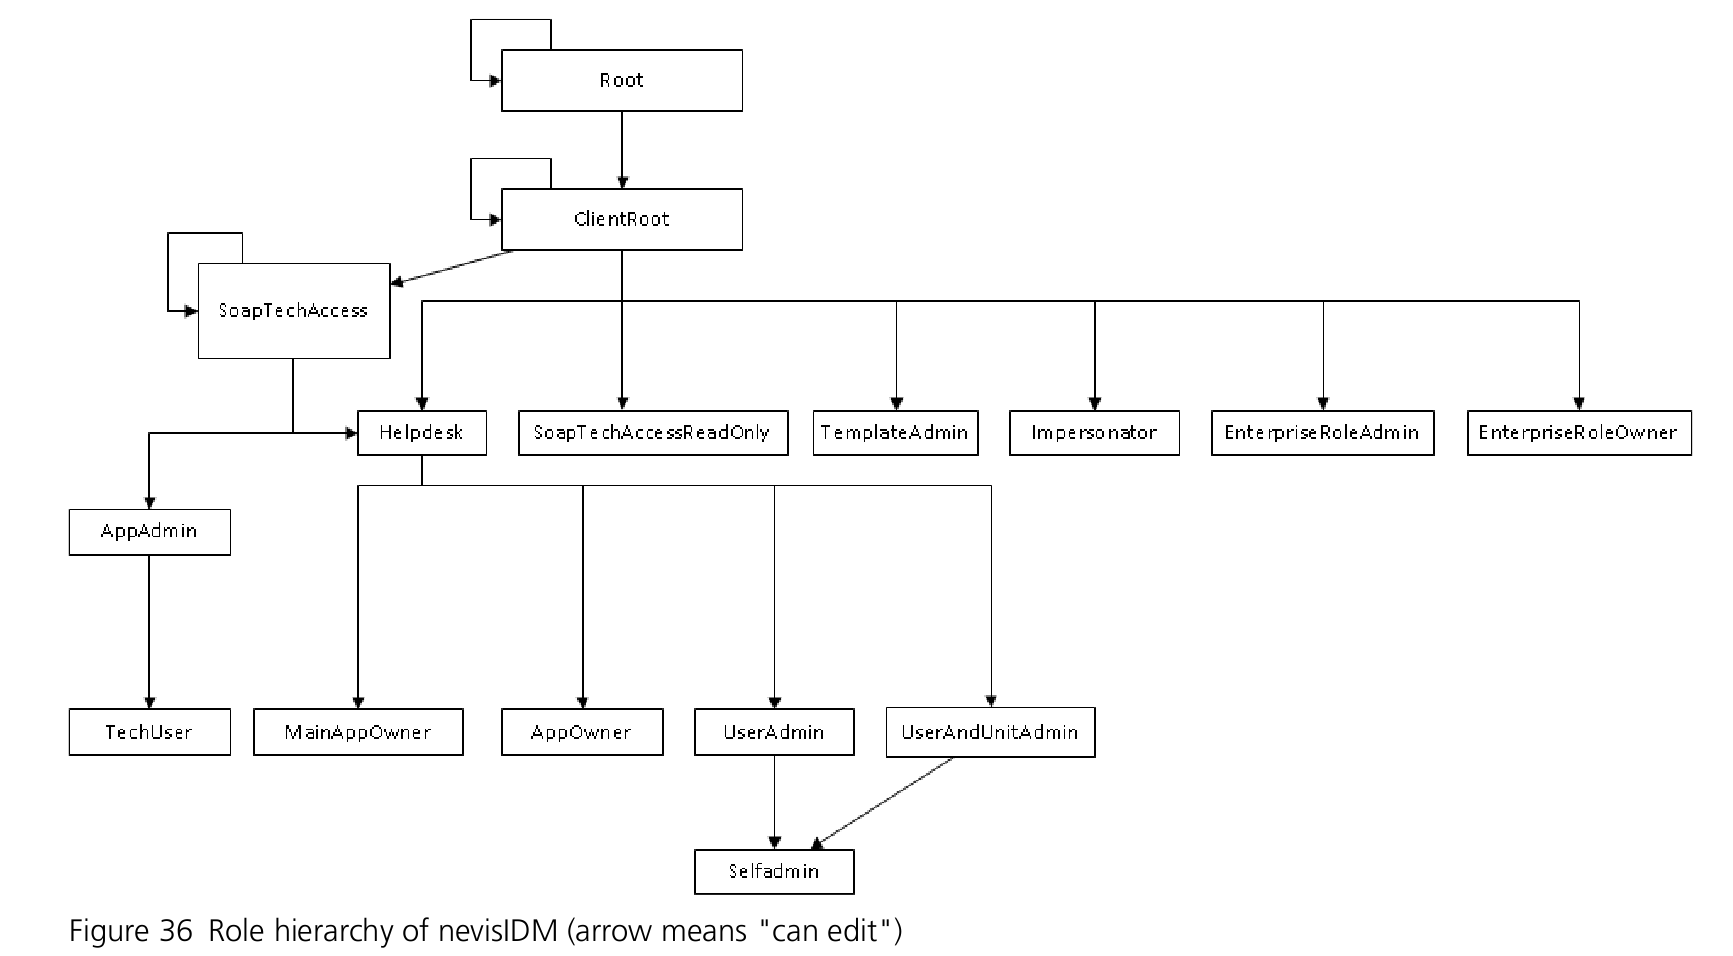
| Role Name | Risk Level |
|---|---|
| nevisIdm.Root | 5 |
| nevisIdm.ClientRoot | 5 |
| nevisIdm.UserAdmin | 4 |
| nevisIdm.MainAppOwner | 3 |
| nevisIdm.AppAdmin | 4 |
| nevisIdm.AppOwner | 3 |
| nevisIdm.SelfAdmin | 1 |
| nevisIdm.Helpdesk | 4 |
| nevisIdm.UserAndUnitAdmin | 4 |
| nevisIdm.TemplateAdmin | 3 |
| nevisIdm.EnterpriseRoleAdmin | 4 |
| nevisIdm.EnterpriseRoleOwner | 3 |
| nevisIdm.BatchJobAdmin | 4 |
| nevisIdm.SoapTechAccess | 4 |
| nevisIdm.SoapTechAccessReadOnly | 3 |
| nevisIdm.TechUser | 3 |
| nevisIdm.Impersonator | 3 |
Verifying configuration
Verifying event logs in Elasticsearch
When you have set up everything, check that event logs arrive in Elasticsearch by executing the following command:
### nevisProxy log line count
curl -s "http://localhost:9200/events-*/_count?pretty;q=type:ProxyRequest" | grep count
### nevisProxy details on first 10 hits
curl "http://localhost:9200/events-*/_search?pretty;q=type:ProxyRequest"

### nevisAuth log line count
curl -s "http://localhost:9200/events-*/_count?pretty;q=type:AuthEvent" | grep count
### nevisAuth details on first 10 hits
curl "http://localhost:9200/events-*/_search?pretty;q=type:AuthEvent"

### nevisIDM log line count
curl -s "http://localhost:9200/events-*/_count?pretty;q=type:AuditEvent" | grep count
### nevisIDM details on first 10 hits
curl "http://localhost:9200/events-*/_search?pretty;q=type:AuditEvent"
- If the log line counts do not increase and Filebeat and Logstash produce no errors in their own log files, check the log /var/opt/nevisreports-es/default/log/elasticsearch.log as a last resort.
Verify complete setup
To test whether your Elasticsearch, Logstash and JRS configurations work, perform the following steps:
Log in to the JRS server using the jasperadmin/jasperadmin account at the following URL:
https://<FQDN_OF_NEVISREPORTS_HOST>:8777/nevisreports/login.html.Navigate to View > Repository. Navigate to the following folder in the repository: Organizations > Organization > Data Sources > Standard.
Verify the connections. For example, edit NEV_DATASRC_IDM > Test Connection.
Check that the reports are working:
Display the Traffic Statistics and Session History reports via the library. If everything is fine, you should see some results ).
Also via the library, display the Authorization Statistics report. If everything is fine, you should see the role assignments of your nevisIDM database.
In case of issues, refer to the WildFly server log: /var/opt/adnwildfly/instances/jrs/log/server.log
Start from the beginning of the log file.
Find and analyze the first full exception trace. This includes any related caused by exceptions.
Note that the repository database configuration is inside the file/var/opt/adnwildfly/instances/jrs/standalone/deployments/nevisreports.war/WEB-INF/js-jboss7-ds.xml and must be changed there, if needed. The copy of the database configuration inside the file nevisreports.propertiesis used during initial installation only and ignored by the web application running inside WildFly.
If needed, restart the server usingnevisreports restart.
Securing and hardening
We recommend implementing the following measures to harden and secure the nevisReports setup:
- [Securing the local MySQL database
- [Securing JDBC Data Source
- External: Use WildFly' vault.sh to secure key store or data source credentials*
- External: Use Logstash'
jdbc_password_filepathto secure data source credentials
Password aliases created using vault.sh can only be used inside container configuration files such as standalone.xml. JapserReports server by default deploys datasource configurations as *-ds.xml files into WEB-INF directory. These configs must be moved into standalone.xml if you want to use aliases.
Default passwords
During the installation, the following default passwords and users are configured. We recommend changing these defaults.
| Service | User | Password | Details |
|---|---|---|---|
| MySQL | root | password | Created when using the default local MySQL repository database, can be changed with mysqladmin. |
| JRS | superuser | superuser | The default JRS superuser account, which can be changed via nevisreports secure. |
| JRS | jasperadmin | jasperadmin | The default JRS admin account, whose password can be changed via nevisreports secure. |
| JRS | testuser | testuser | A sample user account, which is removed when running nevisreports secure. |
| nevisKeybox | password | Created during the nevisReports installation, can be changed using nevisKeybox. |
Securing log transfer with TLS
The Logstash configuration above uses the Lumberjack protocol for transporting logs between hosts.
The Lumberjack protocol supports TLS to encrypt the transport layer (and as such secure the log transport). Therefore, it needs public and private keys as well as a certificate authority (CA) certificate. The receiving host must provide the key material (public and private key pair). On the sending side, the public key (certificate) must be available.
For information on how to create the key material, see the nevisKeybox or the nevisAdmin reference guides. See also <http://www.elastic.co/guide/en/beats/filebeat/6.2/configuring-ssl-logstash.html/>.
nevisReports recommends creating a local self-signed CA on the nevisReports host. However, you can also use an existing CA.
To enable secure log transfer between hosts by means of TLS, perform the following steps:
- Create a local nevisKeybox CA, so that the Logstash server certificate can be signed afterwards. (This step can be skipped when using an existing CA.)
neviskeybox cacreate -ca ca
# Enter PEM pass phrase: <enter password>
# Verifying - Enter PEM pass phrase: <enter password>
- Request a new node certificate for Logstash. It is important that the certificate's common name (CN) matches the host name (by default it does):
neviskeybox certreq -label logstash
# Enter new passphrase: <enter password>
# Confirm new passphrase: <enter password>
# ...
# INFO: Post content of the following file to the correct CA for signing.
# /var/opt/neviskeybox/default/default/logstash_request.pem
- Create a PKCS #8 format of the certificate key (private key):
openssl pkcs8 -in /var/opt/neviskeybox/default/default/logstash_newkey.pem -topk8 -out /var/opt/neviskeybox/default/default/logstash_newkey.pkcs8
# Enter pass phrase for /var/opt/neviskeybox/default/default/logstash_newkey.pem:
# Enter Encryption Password:
# Verifying - Enter Encryption Password:
- Sign the certificate with the local (or existing) CA:
neviskeybox sign -ca ca -file /var/opt/neviskeybox/default/default/logstash_request.pem
# ...
# INFO: New certificate chain to import: /tmp/new_cert.pem
# neviskeybox import -file /tmp/new_cert.pem
- Import the signed certificate into nevisKeybox. Grant the Elasticsearch process user read-access to the certificate as well as its key:
neviskeybox import -file /tmp/new_cert.pem
neviskeybox access -label logstash -group nvbgroup -user nvauser
- Configure the Logstash beats input to use SSL and TLS, by copying and editing the standard configuration:
vim /var/opt/nevisreports-ls/default/templates/custom/logstash.d/events/00-input-beats.conf
Edit the configuration file from/var/opt. Uncomment the lines regarding SSL, then replace them with appropriate values as listed below. For more information, see the official Beats input plugin (elastic) documentation.
Setssl to true.
Set ssl_certificate to the nevisKeybox certificate path (generated in step 2 above).
Set ssl_key to the nevisKeybox private key path (generated in step 3).
Set ssl_key_passphrase to the passphrase for the private key (generated in step 3).
Redeploy the changed Logstash configurations and restart the Logstash instances:
nevisreports-ls deploy-logstash-configs
Be sure to set the JAVA_HOME variable with the correct JDK path, before running the nevisreports-ls commands. Never set the JAVA_HOME variable with a JRE path. 9. Distribute the public key of the certificate authority to all your sending hosts. If the local CA is used, you find the relevant file here: /var/opt/neviskeybox/default/default/truststore/ca.pem. 10. On the sending hosts, change /etc/filebeat/filebeat.yml to use the CA certificate:
# ...snip...
output:
 logstash:
 hosts: <fqdn-of-nevisreports-host>:5044
 ssl.certificate_authorities: /var/opt/neviskeybox/<instance>/<slot>/truststore/<name>.pem
# ...snip...
- Restart the Filebeat daemon (systemctl restart filebeat) and check the log file for errors.
Configuring nevisProxy to protect JRS
The JasperReports Server (JRS) web application allows nevisReports end users to access the system by means of a web browser. This section describes how to configure the JRS web application so that it is protected by the nevisProxy web application firewall.
Configuring the JasperReports Server
To configure the JasperReports Server to consume the SecToken sent by nevisProxy, follow these steps:
- Copy the Ninja/SecToken signer certificate to your nevisReports appliance and import it into your truststore.
# When using neviskeybox
neviskeybox import -slot nevis -label auth -trust -file /path/to/signerCertificate.pem
- Edit the nevisreports.properties, uncomment thenevis.ninja.signerCertificate property and point it to the correct path.
/var/opt/nevisreports/jrs/conf/nevisreports.properties
# JKS file containing the authSigner certificate for verification of the secToken
nevis.ninja.signerCertificate=/var/opt/neviskeybox/default/nevis/truststore.jks
- Set the JAVA_HOME path:
JAVA_HOME=<put-your-path>
export JAVA_HOME
Be sure to set the JAVA_HOME variable with the correct JDK path, before running the nevisreports commands. Never set the JAVA_HOME variable with a JRE path. 4. Deploy the configuration into the WildFly instance and restart the server, then check the logs for errors.
nevisreports deploy-ninja-configs
nevisreports status # check the logs for errors
Configuring nevisProxy
It is possible to configure the necessary settings either by means of nevisAdmin or manually.
nevisAdmin configuration
For a nevisAdmin configuration, follow the next steps:
- Contact Nevis to get the nevisAdmin.exp export file containing the initial configuration for the JRS web application.
- Import nevisReports.exp into nevisAdmin as an application.
- In the Configuration tab, go to the nevisReports application that you just created:
- Open the /nevisReports/ mapping.
- Assign the realm that you want to use to protect nevisReports (e.g., SSO).
- Move the realm entry up in the list of assigned resources such that it is right above the SecTokenBasicAuthDelegation filter.
- In the Infrastructure tab, define the nevisReports back-end host, a web server instance and its connector.
- You can choose the host name and web server instance name freely. For the instance name we recommend "jrs".
- As connector, configure the fully qualified domain name of the web application, port 8777, with SSL enabled.
- In the Configuration tab, edit the mappings for both /nevisreports/ and /nevisreports/JavaScriptServlet/ and configure the back-end host you defined in the previous step.
- Commit and deploy your configuration.
Manual configuration
Configure the JRS web app by incorporating the following XML snippets into the nevisProxy web.xml file.
- For information on where to insert which block, see the nevisProxy reference guide or start from a pre-existing web.xml.
- In the DomainRewriteFilter and the HTTPS connector servlet, replace <FRONTEND_FQDN> and <BACKEND_FQDN> with the fully qualified domain name of the front-end and back-end servers, respectively. Omit the protocol scheme and the port number
- Example<FRONTEND_FQDN>: public.nevisreports.com
- Example <BACKEND_FQDN>: nevisreports-prod.appzone.siven.ch
The XML snippets have been copied from the web.xml file generated by nevisAdmin after following the steps in the previous section.
URL whitelist filter
 <filter>
 <filter-name>NevisReportsURLWhitelistFilter</filter-name>
 <filter-class>ch::nevis::isiweb4::filter::validation::InputValidationFilter</filter-class>
 <init-param>
 <param-name>DecodingRules</param-name>
 <param-value>URL_decode_unicode</param-value>
 </init-param>
 <init-param>
 <param-name>RegexpType</param-name>
 <param-value>PCRE</param-value>
 </init-param>
 <init-param>
 <param-name>CaseSensitiveRegexps</param-name>
 <param-value>true</param-value>
 </init-param>
 <init-param>
 <param-name>URIWhiteList</param-name>
 <param-value>^/nevisreports/JavaScriptServlet$
^/nevisreports/_themes/
^/nevisreports/adminExport\.html$
^/nevisreports/adminImport\.html$
^/nevisreports/customAttributes\.html$
^/nevisreports/dashboard/
^/nevisreports/error\.html$
^/nevisreports/exituser\.html$
^/nevisreports/fileview/
^/nevisreports/flow\.html$
^/nevisreports/flow\.html/flowFile/
^/nevisreports/getReportComponents\.html$
^/nevisreports/getRequirejsConfig\.html$
^/nevisreports/home\.html$
^/nevisreports/logCollectors\.html$
^/nevisreports/log_settings\.html$
^/nevisreports/nevis-public/
^/nevisreports/optimized\-scripts/
^/nevisreports/reportExecutionCountMessage\.html$
^/nevisreports/reportimage$
^/nevisreports/reportresource
^/nevisreports/resetSettings\.html$
^/nevisreports/rest_v2/
^/nevisreports/runtime/
^/nevisreports/runReportAction\.html$
^/nevisreports/scheduler/main\.html$
^/nevisreports/scheduler/undefined/flow\.html$
^/nevisreports/scripts/
^/nevisreports/themes/
^/nevisreports/viewReportPageUpdateCheck\.html$
^/nevisreports[/]?$</param-value>
 </init-param>
 <init-param>
 <param-name>BlockOnError</param-name>
 <param-value>true</param-value>
 </init-param>
 <init-param>
 <param-name>ShowPlainTextValues</param-name>
 <param-value>true</param-value>
 </init-param>
 </filter>
Header for notifying AJAX code that login is needed
 <filter>
 <filter-name>NevisReportsAjaxLoginFilter</filter-name>
 <filter-class>ch::nevis::isiweb4::filter::delegation::HeaderDelegationFilter</filter-class>
 <init-param>
 <param-name>DelegateToFrontend</param-name>
 <param-value>Condition:PARAM:login:.*
LoginRequested:CONST:true</param-value>
 </init-param>
 </filter>
Response Header Suppression Filter
 <filter>
 <filter-name>NevisReportsSuppressHeaderFilter</filter-name>
 <filter-class>ch::nevis::isiweb4::filter::delegation::DelegationFilter</filter-class>
 <init-param>
 <param-name>SuppressResponseHeader</param-name>
 <param-value>X-Powered-By</param-value>
 </init-param>
 </filter>
Standard SecTokenBasicAuthDelegation Filter
  <filter>
 <filter-name>SecTokenBasicAuthDelegation</filter-name>
 <filter-class>ch::nevis::isiweb4::filter::delegation::DelegationFilter</filter-class>
 <init-param>
 <param-name>DelegateBasicAuth</param-name>
 <param-value>AUTH:user.auth.UserId
AUTH:user.auth.SecToken</param-value>
 </init-param>
 </filter>
Domain Rewrite Filter required due to JRS CSRF functionality
 <filter>
 <filter-name>NevisReportsDomainRewriteFilter</filter-name>
 <filter-class>ch::nevis::isiweb4::filter::rewrite::RewriteFilter</filter-class>
 <init-param>
 <param-name>ResponseBody</param-name>
 <param-value>"<BACKEND_FQDN>":"<FRONTEND_FQDN>":PT</param-value>
 </init-param>
 <init-param>
 <param-name>ResponseBody.Mode</param-name>
 <param-value>replacement</param-value>
 </init-param>
 </filter>
Referer Rewrite filter required due to JRS CSRF functionality
 <filter>
 <filter-name>NevisReportsRefererRewriteFilter</filter-name>
 <filter-class>ch::nevis::isiweb4::filter::rewrite::RewriteFilter</filter-class>
 <init-param>
  <param-name>RequestHeader</param-name>
  <param-value>referer:^(http\://|https\://)<FRONTEND_FQDN>(\:\d+)?(.*)$:https\://<BACKEND_FQDN>\:8777$3</param-value>
 </init-param>
</filter>
Cookie Cache filter to retain cookies in nevisProxy cache
<filter>
 <filter-name>NevisReportsCookieFilter</filter-name>
 <filter-class>ch::nevis::isiweb4::filter::cookie::CookieCacheFilter</filter-class>
 <init-param>
  <param-name>CookieManager</param-name>
  <param-value>on</param-value>
 </init-param>
</filter>
HTTPS Connector Servlet
 <servlet>
 <servlet-name>ServletNevisReports0</servlet-name>
 <servlet-class>ch::nevis::isiweb4::servlet::connector::http::HttpsConnectorServlet</servlet-class>
 <init-param>
 <param-name>InetAddress</param-name>
 <param-value><BACKEND_FQDN>:8777</param-value>
 </init-param>
 <init-param>
 <param-name>ResourceManager.RetryTimeout</param-name>
 <param-value>0</param-value>
 </init-param>
 <init-param>
 <param-name>SSLProtocol</param-name>
 <param-value>all-SSLv2</param-value>
 </init-param>
 <init-param>
 <param-name>AllowedMethods</param-name>
 <param-value>HEAD,POST,OPTIONS,PUT,DELETE,GET</param-value>
 </init-param>
 <init-param>
 <param-name>KeepAlive</param-name>
 <param-value>true</param-value>
 </init-param>
 <init-param>
 <param-name>KeepAlive.ByClient</param-name>
 <param-value>false</param-value>
 </init-param>
 <init-param>
 <param-name>CookieManager</param-name>
 <param-value>allow:^.*$</param-value>
 </init-param>
 <init-param>
 <param-name>LogoutURI</param-name>
 <param-value>/nevisreports/exituser.html</param-value>
 </init-param>
 <init-param>
 <param-name>LogoutURI.Interception</param-name>
 <param-value>auto</param-value>
 </init-param>
 </servlet>
Filter and Servlet Mappings
 <filter-mapping>
 <filter-name>NevisReportsURLWhitelistFilter</filter-name>
 <url-pattern>/nevisreports/*</url-pattern>
 </filter-mapping>
 <filter-mapping>
 <filter-name>NevisReportsAjaxLoginFilter</filter-name>
 <url-pattern>/nevisreports/*</url-pattern>
 </filter-mapping>
 <filter-mapping>
 <filter-name>NevisReportsSuppressHeaderFilter</filter-name>
 <url-pattern>/nevisreports/*</url-pattern>
 </filter-mapping>
 <filter-mapping>
 <filter-name>SecTokenBasicAuthDelegation</filter-name>
 <url-pattern>/nevisreports/*</url-pattern>
 </filter-mapping>
 <filter-mapping>
 <filter-name>NevisReportsCookieFilter</filter-name>
 <url-pattern>/nevisreports/*</url-pattern>
 </filter-mapping>
 <filter-mapping>
 <filter-name>NevisReportsRefererRewriteFilter</filter-name>
 <url-pattern>/nevisreports/*</url-pattern>
 </filter-mapping>
 <filter-mapping>
 <filter-name>NevisReportsDomainRewriteFilter</filter-name>
 <url-pattern>/nevisreports/*</url-pattern>
 </filter-mapping>

...

 <servlet-mapping>
 <servlet-name>ServletNevisReports0</servlet-name>
 <url-pattern>/nevisreports/*</url-pattern>
 </servlet-mapping>
Smoke testing
To test whether or not your configuration was successful, do the following:
Go to
https://<YOUR_FRONTEND_FQDN>/nevisreports.Enter the user credentials that are valid for your realm. If everything is fine,
nevisReports will automatically create the user (in the case he/she has never logged in before), and
you will see the library screen directly after login.
If the login is not working, have a look at the following logs:
nevisProxy: navajo.log
nevisReports: /var/opt/adnwildfly/instances/jrs/log/server.log
Upgrade
This guide details the paths for upgrading nevisReports components to the latest version. An upgrade to the latest version is supported by the following versions:* 1.2.0.x and newer
An upgrade consists of deploying the latest required software artefacts of nevisReports components. This includes the latest JRS server components as well as the latest Logstash configurations. Manual adaptions might be required if there are custom Jasper catalogs, Logstash configurations or Elasticsearch scripts.
An upgrade can be performed in two ways:
- In-place upgrade (recommended); or
- Configuration of a parallel instance next to an existing environment (both instances can use the same JRS repository or different ones).
In-place upgrade (recommended)
In case of an in-place upgrade, the following is required:
- nevisAppliance based installation:
- RPM based installation:
1.2.x or 2.x to latest
For upgrading to nevisReports >= 4.0.0, you need to perform some changes in the nevisProxy configuration. Check the latest configuration of nevisProxy at [Configuring nevisProxy to protect JRS.]
From 3.0.0 onwards, the nevisReports product consists of three parts: nevisreports, nevisreports-es and nevisreports-ls. Before starting the in-place upgrade, you need to do certain manual migrations. See the following subsections on how to proceed.
nevisreports-es
- Set the JAVA_HOME path:
JAVA_HOME=<put-your-path>
export JAVA_HOME
Be sure to set the JAVA_HOME variable with the correct JDK path, before running the nevisreports-escommands. Never set the JAVA_HOME variable with a JRE path. 2. Verify the version of the installed nevisreports-es with the following command:
#### shows the nevisreports-es package version
nevisreports-es pkg
- Create a default instance of nevisreports-es by running the following command:
nevisreports-es inst create
- Manually merge custom configurations of "yml" or any other configurations files from /var/opt/elasticsearch to /var/opt/nevisreports-es.
- Copy the custom es-scripts zip file to /var/opt/nevisreports-es/default/templates/scripts/custom.
Migrate all custom es-scripts and queries (if any) to support the Elasticsearch 6.2.4 version. Some breaking changes are listed below for awareness.
- The terms "filtered", "and", "or", "not" and "missing" are deprecated and removed.
- Deprecation of file-based templates (https://github.com/elastic/elasticsearch/issues/21798) . You need to migrate to a new format for pre-registered templates.
- The "type" field has been deprecated and removed (
<http://www.elastic.co/guide/en/elasticsearch/reference/6.2/removal-of-types.html/>)For reference, take standard es-scripts as base. Also see the Developer Guide for more information.
- Change the owner and group of the data directory:
chown -R nvauser:nvbgroup /var/opt/nevisreports-es/default
- Enable the nevisreports-es system service:
systemctl enable nevisreports-es.service
- Start the nevisreports-es default service:
systemctl start nevisreports-es.service
- Deploy both the standard and custom es-scripts, by running the following command:
nevisreports-es deploy-installed-es-scripts
- Check the status of the service:
systemctl status nevisreports-es
- Perform the following simple test to check that the service is properly started:
curl -XGET localhost:9200
- After successfully upgrading nevisreports-es, you can perform the data migration. For more information, see the [Data migration] page.
Enable nevisreports-es to access the old cluster (2.4.4), by adding the old cluster to reindex.remote.whitelist in the elasticsearch.yml file, under /var/opt/nevisreports-es/default/config:
reindex.remote.whitelist: oldhost:9200
nevisreports-ls
- Set the JAVA_HOME path:
JAVA_HOME=<put-your-path>
export JAVA_HOME
Be sure to set the JAVA_HOME variable with the correct JDK path, before running the nevisreports-lscommands. Never set the JAVA_HOME variable with a JRE path. 2. Verify the version of the installed nevisreports-ls with the following command:
nevisreports-ls pkg # shows the nevisreports-ls package version
- Copy the properties template file to the /tmp directory. Perform the required changes to the properties file:
cp /opt/nevisreports-ls/templates/config/nevisreports-ls.properties /tmp/
- Create a default instance of nevisreports-ls by running the following command:
nevisreports-ls inst create /tmp/nevisreports-ls.properties
- Copy the custom events and stats configuration and filter files, by executing the following command:
cp -r /var/opt/nevisreports/jrs/template-logstash.d/* /var/opt/nevisreports-ls/default/templates/custom/logstash.d/
Migration of custom filter to support Event APIs
Before copying the custom plugin filter configuration files, migrate the filters to support Event APIs. This is necessary because the eventobject is no longer accessible directly from Logstash version 5.0 (deprecated and removed). Replace the event objects with Event APIs and use Getters/Setters for accessing information in events.
- To find out more about this breaking change, refer to Event API.
- For code reference, see filter configuration files (.conf) for events and stats.
- Deploy both the standard and the custom configurations, with the following command:
nevisreports-ls deploy-logstash-configs
- Enable the events and stats system services:
systemctl enable [email protected]
systemctl enable [email protected]
- Start the events and stats system services:
systemctl start nevisreports-ls@events
systemctl start nevisreports-ls@stats
- Check the status of both the events and the stats system services:
systemctl status nevisreports-ls@events
systemctl status nevisreports-ls@stats
- To view the complete logs of the events and the stats services, run the following command:
journalctl -u nevisreports-ls@events
journalctl -u nevisreports-ls@stats
- Check that the service is properly started:
netstat -nltp # check for port 5044(default port for events service)
nevisreports
- Set the JAVA_HOME path:
JAVA_HOME=<put-your-path>
export JAVA_HOME
Be sure to set the JAVA_HOME variable with the correct JDK path, before running the nevisreportscommands. Never set the JAVA_HOME variable with a JRE path. 2. Verify which version of nevisReports is installed:
# shows the nevisReports package version
nevisreports pkg
- Create a backup of the repository database, if there are any database changes between the previously installed version and the current version (refer to the release notes for that information).
- For Oracle, contact the database administrator for help.
- For MySQL, use the mysqldump utility or contact the database administrator for help.
- The names of the nevisIDM database connection properties have been changed. Change the name of the following properties in /var/opt/nevisreports/jrs/conf/nevisreports.properties:
nevis_reports_stats_nevisidm_jdbc_connection_string --> nevis_reports_nevisidm_jdbc_connection_string
nevis_reports_stats_nevisidm_db_user --> nevis_reports_nevisidm_db_user
nevis_reports_stats_nevisidm_db_password --> nevis_reports_nevisidm_db_password
The following properties are removed from the nevisReports properties template file:
nevis_reports_stats_nevisidm_jdbc_driver_jar
nevis_reports_stats_nevisidm_jdbc_driver_class 5. Stop the nevisReports server if it is already running:
nevisreports stop
- In the /var/opt/nevisreports/jrs/conf/nevisreports.properties file, set the value of the property appServerType to "wildfly".
appServerType=wildfly
- Upgrade the nevisReports instance to the latest version:
nevisreports upgrade
- After a successful upgrade, the nevisReports application, Elasticsearch and Logstash should be up and running. Check that all services have started with the following commands:
# for JRS application status
nevisreports status
# for Elasticsearch
systemctl status nevisreports-es

# For Logstash instances
systemctl status nevisreports-ls@events
systemctl status nevisreports-ls@stats
If there are any problems with these servers, check the log files for errors. 9. Log in to the JasperReports Server web application to confirm that everything works as expected.
3.x to latest
For upgrading to nevisReports >= 4.0.0, you need to perform some changes in the nevisProxy configuration. Check the latest configuration of nevisProxy at [Configuring nevisProxy to protect JRS.]
Perform the steps below to upgrade all three nevisReports components nevisreports, nevisreports-es and nevisreports-lsto the next version.
nevisreports-es
- Set the JAVA_HOME path:
JAVA_HOME=<put-your-path>
export JAVA_HOME
Be sure to set the JAVA_HOME variable with the correct JDK path, before running the nevisreports-escommands. Never set the JAVA_HOME variable with a JRE path. 2. Verify the version of the installed nevisreports-es with the following command:
# shows the nevisreports-es package version
nevisreports-es pkg
- Stop the nevisreports-es instance:
systemctl stop nevisreports-es
- Move the /var/opt/nevisreports-es directory to /var/opt/nevisreports-es-3.0:
mv /var/opt/nevisreports-es /var/opt/nevisreports-es-3.0
- Create a default instance of nevisreports-es by running the following command:
nevisreports-es inst create
- Manually merge custom configurations of "yml" or any other configuration files from /var/opt/nevisreprots-es-3.0 to /var/opt/nevisreports-es.
- Copy the custom es-scripts zip file to /var/opt/nevisreports-es/default/templates/scripts/custom.
Migrate all custom es-scripts and queries (if any) to support the Elasticsearch 6.2.4 version. Some breaking changes are listed below for awareness.
- The terms "filtered", "and", "or", "not" and "missing" are deprecated and removed.
- Deprecation of file-based templates (https://github.com/elastic/elasticsearch/issues/21798) . You need to migrate to a new format for pre-registered templates.
- The "type" field has been deprecated and removed (
<http://www.elastic.co/guide/en/elasticsearch/reference/6.2/removal-of-types.html/>).For reference, take standard es-scripts as base. Also see the Developer Guide for more information.
- Change the owner and group of the data directory:
chown -R nvauser:nvbgroup /var/opt/nevisreports-es/default
- Enable the nevisreports-es system service:
systemctl enable nevisreports-es.service
- Start the nevisreports-es default service:
systemctl start nevisreports-es.service
- Deploy both the standard and custom es-scripts, by running the following command:
nevisreports-es deploy-installed-es-scripts
- Check the status of the service:
systemctl status nevisreports-es
- Perform the following simple test to check that the service is properly started:
curl -XGET localhost:9200
- After successfully upgrading nevisreports-es, you can perform the data migration. For more information, see the [Data migration] page.
Enable nevisreports-es to access the old cluster (2.4.4), by adding the old cluster to reindex.remote.whitelist in the elasticsearch.yml file, under /var/opt/nevisreports-es/default/config: reindex.remote.whitelist: oldhost:9200
nevisreports-ls
- Set the JAVA_HOME path:
JAVA_HOME=<put-your-path>
export JAVA_HOME
Be sure to set the JAVA_HOME variable with the correct JDK path, before running the nevisreports-lscommands. Never set the JAVA_HOME variable with a JRE path. 2. Verify the version of the installed nevisreports-ls with the following command:
nevisreports-ls pkg # shows the nevisreports-ls package version
- Rename /var/opt/nevisreports-ls to /var/opt/nevisreports-ls-3.0:
mv /var/opt/nevisreports-ls /var/opt/nevisreports-ls-3.0
- Copy the properties template file to the /tmp directory. Perform the required changes to the properties file or manually merge previous configurations:
cp /opt/nevisreports-ls/templates/config/nevisreports-ls.properties /tmp/
- Create a default instance of nevisreports-ls by running the following command:
nevisreports-ls inst create /tmp/nevisreports-ls.properties
- Copy the custom events and stats configurations and filter files, by executing the following command:
cp -r /var/opt/nevisreports-ls-3.0/default/templates/custom/logstash.d/* /var/opt/nevisreports-ls/default/templates/custom/logstash.d/
Migration of custom filter to support Event APIs:
Before performing the upgrade, migrate the custom plugin filters to support Event APIs. This is necessary because the eventobject is no longer accessible directly from Logstash version 5.0 (deprecated and removed). Replace the event objects with Event APIs and use Getters/Setters for accessing information in events.
- To find out more about this breaking change, refer to Event API.
- For code reference, see filter configuration files (.conf) for events and stats.
- Deploy both the standard and the custom configurations, with the following command:
nevisreports-ls deploy-logstash-configs
- Enable the events and stats system services:
systemctl enable [email protected]
systemctl enable [email protected]
- Start the events and stats system services:
systemctl start nevisreports-ls@events
systemctl start nevisreports-ls@stats
- Check the status of both the events and the stats system services:
systemctl status nevisreports-ls@events
systemctl status nevisreports-ls@stats
- To view the complete logs of the events and the stats services, run the following command:
journalctl -u nevisreports-ls@events
journalctl -u nevisreports-ls@stats
- Check that the service has properly started by executing the following test:
netstat -nltp # check for port 5044(default port for events service)
- Remove the /var/opt/nevisreports-ls-3.0 directory:
rm -rf /var/opt/nevisreports-ls-3.0
nevisreports
- Set the JAVA_HOME path:
JAVA_HOME=<put-your-path>
export JAVA_HOME
Be sure to set the JAVA_HOME variable with the correct JDK path, before running the nevisreportscommands. Never set the JAVA_HOME variable with a JRE path. 2. Verify which version of nevisReports is installed:
# shows the nevisReports package version
nevisreports pkg
- Create a backup of the repository database, if there are any database changes between the previously installed version and the current version (refer to the release notes for that information).
- For Oracle, contact database administrator for help.
- For MySQL, use the mysqldump utility or contact database administrator for help.
- Stop the nevisReports server if it is already running:
nevisreports stop
- Change the value of the property appServertype to "wildfly" in the /var/opt/nevisreports/jrs/conf/nevisreports.properties file.
appServertype=wildfly
- Upgrade the nevisReports instance to the latest version:
nevisreports upgrade
- After a successful upgrade, the nevisReports application, Elasticsearch and Logstash should be up and running. Check if all services have started by executing the following commands:
# for JRS application status
nevisreports status
# for Elasticsearch
systemctl status nevisreports-es

# For Logstash instances
systemctl status nevisreports-ls@events
systemctl status nevisreports-ls@stats
If there are any problems with these servers, check the log files for errors. 8. Log in to the JasperReports Server web application to check that everything is working as expected.
Filebeat Upgrade
After upgrading the appliance, make the following changes to the filebeat.yml file.
- The document_type property has been dropped from Filebeat version 6.0 on. Remove the document_type property from the filebeat.yml file (if present). Set the document type by adding a new custom field type under "fields".
- The handling of the host field has changed from Filebeat version 6.6 onwards. Refer to the respective sample filebeat.yml file below.
Choose the correct sample filebeat.yml file according to the version of Filebeat installed on your nevisAppliance/RHEL7. See Support Matrix for an overview of the supported versions.
Sample: filebeat.yml version 6.2.x
 filebeat:
 prospectors:
 -
 paths: /var/opt/nevisproxy/*/log*/*-events.log*
 exclude_files: ['\.gz$']
 fields_under_root: true
 fields:
 host: "<local-host-name>"
 type: "nevisproxy-events"
 -
 paths: /var/opt/nevisauth/*/log*/*-events.log*
 exclude_files: ['\.gz$']
 fields_under_root: true
 fields:
 host: "<local-host-name>"
 type: "nevisauth-events"
 -
 paths: /var/opt/nevisidm/*/log/*-events.log*
 exclude_files: ['\.gz$']
 fields_under_root: true
 fields:
 host: "<local-host-name>"
 type: "nevisidm-events"
output:
 logstash:
 hosts: <fqdn-of-nevisreports-host>:5044
 # To secure log transfer with TLS see chapter "Securing log transfer with TLS"
 # ssl.certificate_authorities: /var/opt/neviskeybox/<instance>/<slot>/truststore/<name>.pem
logging:
 to_files: true
 files:
 path: /var/log/filebeat
 name: filebeat.log
 rotateeverybytes: 10485760 # = 10MB
 keepfiles: 7
 level: error
Sample: filebeat.yml version 6.6.x / 6.7.x
filebeat:
 prospectors:
 -
 paths: /var/opt/nevisproxy/*/log*/*-events.log*
 exclude_files: ['\.gz$']
 fields_under_root: true
 fields:
 type: "nevisproxy-events"
 -
 paths: /var/opt/nevisauth/*/log*/*-events.log*
 exclude_files: ['\.gz$']
 fields_under_root: true
 fields:
 type: "nevisauth-events"
 -
 paths: /var/opt/nevisidm/*/log/*-events.log*
 exclude_files: ['\.gz$']
 fields_under_root: true
 fields:
 type: "nevisidm-events"
processors:
- rename.fields:
 - from: "host.name"
 to: "tempHost"
- drop_fields.fields:
 - "host"
- rename.fields:
 - from: "tempHost"
 to: "host"
output:
 logstash:
 hosts: <fqdn-of-nevisreports-host>:5044
 # To secure log transfer with TLS see chapter "Securing log transfer with TLS"
 # ssl.certificate_authorities: /var/opt/neviskeybox/<instance>/<slot>/truststore/<name>.pem
logging:
 to_files: true
 files:
 path: /var/log/filebeat
 name: filebeat.log
 rotateeverybytes: 10485760 # = 10MB
 keepfiles: 7
 level: error
Data migration
This section is only valid when the upgrade is done from nevisReports < 4.1.0 .
All nevisReports versions < 4.1.0 use an older version of Elasticsearch (<=2.4), which is not compatible with the latest version of nevisReports that comes with Elasticsearch > 6.2.x . To upgrade to the latest version of nevisReports, you need to migrate the old data to the new format. This chapter gives step-by-step instructions on how to do this.
Setting up manual migration directories
We assume that you use the nevisReports standard Filebeat configuration. To set up manual migration directories, perform the following steps:
- Create the following directories to mirror the original Nevis component log directories. Create as many directories as there are components and instances on the host. Later on, you store the log files manually into the corresponding directories.
/var/log/migration-logs/<component>/<instance>/log
Example
/var/log/migration-logs/nevisproxy/proxy1/logs/
/var/log/migration-logs/nevisproxy/proxy2/logs/
/var/log/migration-logs/nevisauth/auth/log/
- Add the new log directories to the existing paths in the /etc/filebeat/filebeat.yml configuration as shown in the next code block:
YAML is white-space- and indention-sensitive.
/etc/filebeat/filebeat.yml
filebeat:
 prospectors:
 -
 paths:
 - "/var/opt/nevis*/*/log*/*-events.log"
  - "/var/log/migration-logs/nevisproxy/*/log*/*-events.log.*"
   fields:
 host: "<local-host-name>"
 type: "nevisproxy-events"
  output:
 logstash:
 hosts: <fqdn-of-nevisreports-host:5044
 tls:
 certificate_authorities: /var/opt/neviskeybox/<instance>/<slot>/truststore/<name>.pem
logging:
 to_files: true
 files:
 path: /var/log/filebeat
 name: filebeat.log
 rotateeverybytes: 10485760 # = 10MB
 keepfiles: 7
 level: error
Preraring a supporting configuration on the nevisReports appliance
To be able to migrate the log files, prepare a supporting configuration on the nevisReports appliance. Therefore, manually add the migration file paths to the 00-input-beats.conf file, as shown in the following code block.
/var/opt/elasticsearch/config/logstash.d/00-input-beats.conf
# Note: the filebeat configuration (on the sending host) must set the
# "type" field of each message to either "nevisproxy-events" or "nevisauth-events"
# for the event to be processed by the filters on the receiving host.
input {
 beats {
 port => 5044
 ssl_certificate => "/var/opt/neviskeybox/default/default/node_certificate.pem"
 ssl_key => "/var/opt/elasticsearch/config/node_key.pem"
 }
}
# Decode metadata fields from log file field
filter {
 grok {
 match => [
 "file", "/var/opt/%{NVDIR:comp}/%{NVDIR:instance}/logs/%{NVDIR:type}\.log",
 "file", "/var/opt/%{NVDIR:comp}/%{NVDIR:instance}/log/%{NVDIR:type}\.log",
 "file", "/var/log/migration-logs/%{NVDIR:comp}/%{NVDIR:instance}/logs?/%{NVDIR:type}\.log\..*"
 ]
 }
 if ![comp] {
 mutate {
 add_field => [ "comp", "UNKNOWN" ]
 }
 }
 if ![instance] {
 mutate {
 add_field => [ "instance", "UNKNOWN" ]
 }
 }
 if ![type] {
 mutate {
 add_field => [ "type", "UNKNOWN" ]
 }
 }
}
Migration steps
The actual migration consists of the following steps:
- Log in to the sending host.
- Copy the log files to the relevant migration path. For example, if you are migrating log files for the nevisProxy instance named proxy1, you should deposit the log files into /var/log/migration-logs/nevisProxy/proxy1/logs. Select only those log files that cover the period you are interested in.
- If you want to migrate data logs from version 4.0.0 to 4.1.0, follow the steps mentioned in the next note.
To migrate data logs from version 4.0.0 to 4.1.0, execute the following steps before you start migrating the logs:
- Stop nevisreports-es.- Make a backup of the nevisreports-es data directory (/var/log/nevisreports-es/default/data), then remove the data directory.
- Start nevisreports-es.
- Now Filebeat will automatically start shipping the logs.
- When you are sure that all files have been shipped, you can remove the files from the directories.
4.x to latest
For upgrading to nevisReports >= 4.0.0, you need to perform some changes in the nevisProxy configuration. Check the latest configuration of nevisProxy at [Configuring nevisProxy to protect JRS.]
Perform the steps below to upgrade all three nevisReports components nevisreports, nevisreports-es and nevisreports-lsto the next version.
nevisreports-es
- Set the JAVA_HOME path:
JAVA_HOME=<put-your-path>
export JAVA_HOME
Be sure to set the JAVA_HOME variable with the correct JDK path, before running the nevisreports-escommands. Never set the JAVA_HOME variable with a JRE path. 2. Verify the version of the installed nevisreports-es with the following command:
# shows the nevisreports-es package version
nevisreports-es pkg
- Stop the nevisreports-es instance:
systemctl stop nevisreports-es
- Move the /var/opt/nevisreports-es directory to /var/opt/nevisreports-es-4.0:
mv /var/opt/nevisreports-es /var/opt/nevisreports-es-4.0
- Create a default instance of nevisreports-es by running the following command:
nevisreports-es inst create
- Manually merge custom configurations of "yml" or any other configuration files from /var/opt/nevisreprots-es-4.0 to /var/opt/nevisreports-es.
- Copy the custom es-scripts zip file to /var/opt/nevisreports-es/default/templates/scripts/custom.
Migrate all custom es-scripts and queries (if any) to support the Elasticsearch 6.7.1 version. Some breaking changes are listed below for awareness.
- The terms "filtered", "and", "or", "not" and "missing" are deprecated and removed.
- Deprecation of file-based templates (https://github.com/elastic/elasticsearch/issues/21798) . You need to migrate to a new format for pre-registered templates.
- The "type" field has been deprecated and removed (
<http://www.elastic.co/guide/en/elasticsearch/reference/6.2/removal-of-types.html/>).For reference, take standard es-scripts as base. Also see the Developer Guide for more information.
- Change the owner and group of the data directory:
chown -R nvauser:nvbgroup /var/opt/nevisreports-es/default
- Enable the nevisreports-es system service:
systemctl enable nevisreports-es.service
- Start the nevisreports-es default service:
systemctl start nevisreports-es.service
- Deploy both the standard and custom es-scripts, by running the following command:
nevisreports-es deploy-installed-es-scripts
- Check the status of the service:
systemctl status nevisreports-es
- Perform the following simple test to check that the service is properly started:
curl -XGET localhost:9200
- After successfully upgrading nevisreports-es, you can perform the data migration. For more information, see the [Data migration] page.
Enable nevisreports-es to access the old cluster (2.4.4), by adding the old cluster to reindex.remote.whitelist in the elasticsearch.yml file, under /var/opt/nevisreports-es/default/config: reindex.remote.whitelist:localhost:9200
nevisreports-ls
- Set the JAVA_HOME path:
JAVA_HOME=<put-your-path>
export JAVA_HOME
Be sure to set the JAVA_HOME variable with the correct JDK path, before running the nevisreports-lscommands. Never set the JAVA_HOME variable with a JRE path. 2. Verify the version of the installed nevisreports-ls with the following command:
nevisreports-ls pkg # shows the nevisreports-ls package version
- Rename /var/opt/nevisreports-ls to /var/opt/nevisreports-ls-4.0:
mv /var/opt/nevisreports-ls /var/opt/nevisreports-ls-4.0
- Copy the properties template file to the /tmp directory. Perform the required changes to the properties file or manually merge previous configurations:
cp /opt/nevisreports-ls/templates/config/nevisreports-ls.properties /tmp/
- Create a default instance of nevisreports-ls by running the following command:
nevisreports-ls inst create /tmp/nevisreports-ls.properties
- Copy the custom events configurations and filter files, by executing the following command:
cp -r /var/opt/nevisreports-ls-4.0/default/templates/custom/logstash.d/* /var/opt/nevisreports-ls/default/templates/custom/logstash.d/
Migration of custom filters to support Event APIs:
Before performing the upgrade, migrate the custom plugin filters to support Event APIs. This is necessary because the eventobject is no longer accessible directly from Logstash version 5.0 (deprecated and removed). Replace the event objects with Event APIs and use Getters/Setters for accessing information in events.
- To find out more about this breaking change, refer to Event API.
- For code reference, see the filter configuration files (.conf) for events.
- Deploy both the standard and the custom configurations, with the following command:
nevisreports-ls deploy-logstash-configs
- Enable the events system services:
systemctl enable [email protected]
- Start the events system services:
systemctl start nevisreports-ls@events
- Check the status of the events system services:
systemctl status nevisreports-ls@events
- To view the complete logs of the events services, run the following command:
journalctl -u nevisreports-ls@events
- Check that the service has properly started by executing the following test:
netstat -nltp # check for port 5044(default port for events service)
- Remove the /var/opt/nevisreports-ls-4.0 directory:
rm -rf /var/opt/nevisreports-ls-4.0
nevisreports
- Set the JAVA_HOME path:
JAVA_HOME=<put-your-path>
export JAVA_HOME
Be sure to set the JAVA_HOME variable with the correct JDK path, before running the nevisreportscommands. Never set the JAVA_HOME variable with a JRE path. 2. Verify which version of nevisReports is installed:
# shows the nevisReports package version
nevisreports pkg
- Create a backup of the repository database, if there are any database changes between the previously installed version and the current version (refer to the release notes for that information).
- For Oracle, contact database administrator for help.
- For MySQL, use the mysqldump utility or contact database administrator for help.
- Stop the nevisReports server if it is already running:
nevisreports stop
- Change the value of the property appServertype to "wildfly" in the /var/opt/nevisreports/jrs/conf/nevisreports.properties file.
appServertype=wildfly
- Upgrade the nevisReports instance to the latest version:
nevisreports upgrade
- After a successful upgrade, the nevisReports application, Elasticsearch and Logstash should be up and running. Check if all services have started by executing the following commands:
# for JRS application status
nevisreports status
# for Elasticsearch
systemctl status nevisreports-es

# For Logstash instances
systemctl status nevisreports-ls@events
If there are any problems with these servers, check the log files for errors. 8. Log in to the JasperReports Server web application to check that everything is working as expected. 9. Check for and remove any legacy reports:
- In the user interface, go to View/Repository:
 2. Check whether the legacy reports have been removed:
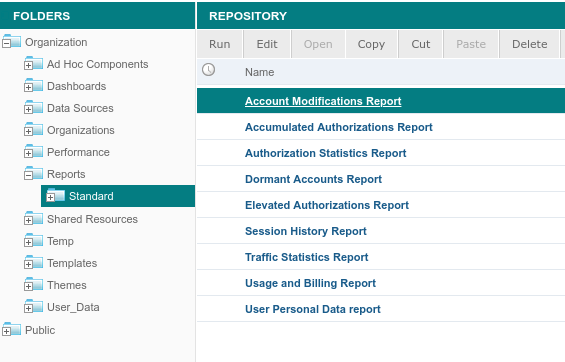 3. Select each still existing legacy report and delete it by clicking on *Delete*. The following reports are legacy reports:
Dormant Authorizations report
ACAA Overview report
4.3.0 to latest
For upgrading to nevisReports >= 4.3.0, you need to perform some changes in the nevisProxy configuration. Check the latest configuration of nevisProxy in chapter Configuring nevisProxy to protect JRS.
Perform the steps below to upgrade all three nevisReports components nevisreports, nevisreports-es and nevisreports-lsto the next version.
nevisreports-es
- Set the JAVA_HOME path:
JAVA_HOME=<put-your-path>
export JAVA_HOME
Be sure to set the JAVA_HOME variable with the correct JDK path, before running the nevisreports-escommands. Never set the JAVA_HOME variable with a JRE path. 2. Verify the version of the installed nevisreports-es with the following command:
# shows the nevisreports-es package version
nevisreports-es pkg
- Stop the nevisreports-es instance:
systemctl stop nevisreports-es
- Move the /var/opt/nevisreports-es directory to the /var/opt/nevisreports-es-4.3.0 directory:
mv /var/opt/nevisreports-es /var/opt/nevisreports-es-4.3.0
- Create a default instance of nevisreports-es by running the following command:
nevisreports-es inst create
- Manually merge custom configurations in the ".yml" file format or any other configuration files from /var/opt/nevisreports-es-4.3.0 to /var/opt/nevisreports-es.
- Copy the custom es-scripts .zip file to /var/opt/nevisreports-es/default/templates/scripts/custom.
Migrate all custom es-scripts and queries (if any) to support the Elasticsearch 7.9.2 version. Some breaking changes are listed below for awareness.
- "Hits.total" will turn from value to object (`http://www.elastic.co/guide/en/elasticsearch/reference/7.9/breaking-changes-7.0.html#hits-total-now-object-search-response)For reference, take standard es-scripts as base. See the Developer Guide for more information.
- Change the owner and group of the data directory:
chown -R nvauser:nvbgroup /var/opt/nevisreports-es/default
- Enable the nevisreports-es system service:
systemctl enable nevisreports-es.service
- Start the nevisreports-es default service:
systemctl start nevisreports-es.service
- Deploy both the standard and custom es-scripts, by running the following command:
nevisreports-es deploy-installed-es-scripts
- Check the status of the service:
systemctl status nevisreports-es
- Perform the following simple test to check that the service is properly started:
curl -XGET localhost:9200
- After successfully upgrading nevisreports-es, you can perform the data migration. For more information, see the chapter Data migration.
Enable nevisreports-es to access the old cluster (6.2.x), by adding the old cluster to reindex.remote.whitelist in the elasticsearch.yml file, under /var/opt/nevisreports-es/default/config: reindex.remote.whitelist:localhost:9200
nevisreports-ls
- Set the JAVA_HOME path:
JAVA_HOME=<put-your-path>
export JAVA_HOME
Be sure to set the JAVA_HOME variable with the correct JDK path, before running the nevisreports-lscommands. Never set the JAVA_HOME variable with a JRE path. 2. Verify the version of the installed nevisreports-ls with the following command:
nevisreports-ls pkg # shows the nevisreports-ls package version
- Rename /var/opt/nevisreports-ls to /var/opt/nevisreports-ls-4.3.0:
mv /var/opt/nevisreports-ls /var/opt/nevisreports-ls-4.3.0
- Copy the properties template file to the /tmp directory. Perform the required changes to the properties file or manually merge previous configurations:
cp /opt/nevisreports-ls/templates/config/nevisreports-ls.properties /tmp/
- Create a default instance of nevisreports-ls by running the following command:
nevisreports-ls inst create /tmp/nevisreports-ls.properties
- Copy the custom events configurations and filter files, by executing the following command:
cp -r /var/opt/nevisreports-ls-4.3.0/default/templates/custom/logstash.d/* /var/opt/nevisreports-ls/default/templates/custom/logstash.d/
Note that the Elasticsearch mapping removed the "doc" type/level. Also, the mapping validation has become stricter for dynamic templates. See also `http://www.elastic.co/guide/en/elasticsearch/reference/7.9/breaking-changes-7.7.html#stricter-mapping-validation. 7. Deploy both the standard and the custom configurations, with the following command:
nevisreports-ls deploy-logstash-configs
- Enable the events system services:
systemctl enable [email protected]
- Start the events system services:
systemctl start nevisreports-ls@events
- Check the status of the events system services:
systemctl status nevisreports-ls@events
- To view the complete logs of the events services, run the following command:
journalctl -u nevisreports-ls@events
- Check that the service has properly started by executing the following test:
netstat -nltp # check for port 5044(default port for events service)
- Remove the /var/opt/nevisreports-ls-4.3.0 directory:
rm -rf /var/opt/nevisreports-ls-4.3.0
nevisreports
- Set the JAVA_HOME path:
JAVA_HOME=<put-your-path>
export JAVA_HOME
Be sure to set the JAVA_HOME variable with the correct JDK path, before running the nevisreportscommands. Never set the JAVA_HOME variable with a JRE path. 2. Verify which version of nevisReports is installed:
# shows the nevisReports package version
nevisreports pkg
- Create a backup of the repository database, if there are any database changes between the previously installed version and the current version (refer to the release notes for that information).
- For Oracle, contact the database administrator for help.
- For MySQL, use the mysqldump utility or contact the database administrator for help.
- Stop the nevisReports server if it is already running:
nevisreports stop
- Change the value of the property appServertype to "wildfly" in the /var/opt/nevisreports/jrs/conf/nevisreports.properties file.
appServertype=wildfly
- Upgrade the nevisReports instance to the latest version:
nevisreports upgrade
- After a successful upgrade, the nevisReports application, Elasticsearch and Logstash should be up and running. Check if all services have started by executing the following commands:
# for JRS application status
nevisreports status
# for Elasticsearch
systemctl status nevisreports-es

# For Logstash instances
systemctl status nevisreports-ls@events
If there are any problems with these servers, check the log files for errors. 8. Log in to the JasperReports Server web application to check that everything is working as expected. 9. Check for and remove any legacy reports:
- In the user interface, go to View > Repository:

Check whether the legacy reports have been removed.
Legacy reports
The following reports are legacy reports:
- Dormant Authorizations report
- ACAA Overview report

- Select each still existing legacy report and delete it by clicking on Delete.
4.3.0 to latest
For upgrading to nevisReports >= 4.3.0, you need to perform some changes in the nevisProxy configuration. Check the latest configuration of nevisProxy in chapter Configuring nevisProxy to protect JRS.
Perform the steps below to upgrade all three nevisReports components nevisreports, nevisreports-es and nevisreports-lsto the next version.
nevisreports-es
- Set the JAVA_HOME path:
JAVA_HOME=<put-your-path>
export JAVA_HOME
Be sure to set the JAVA_HOME variable with the correct JDK path, before running the nevisreports-escommands. Never set the JAVA_HOME variable with a JRE path. 2. Verify the version of the installed nevisreports-es with the following command:
#### shows the nevisreports-es package version
nevisreports-es pkg
- Stop the nevisreports-es instance:
systemctl stop nevisreports-es
- Move the /var/opt/nevisreports-es directory to the /var/opt/nevisreports-es-4.3.0 directory:
mv /var/opt/nevisreports-es /var/opt/nevisreports-es-4.3.0
- Create a default instance of nevisreports-es by running the following command:
nevisreports-es inst create
- Manually merge custom configurations in the ".yml" file format or any other configuration files from /var/opt/nevisreports-es-4.3.0 to /var/opt/nevisreports-es.
- Copy the custom es-scripts .zip file to /var/opt/nevisreports-es/default/templates/scripts/custom.
Migrate all custom es-scripts and queries (if any) to support the Elasticsearch 7.9.2 version. Some breaking changes are listed below for awareness.
- "Hits.total" will turn from value to object (`http://www.elastic.co/guide/en/elasticsearch/reference/7.9/breaking-changes-7.0.html#hits-total-now-object-search-response)For reference, take standard es-scripts as base. See the Developer Guide for more information.
- Change the owner and group of the data directory:
chown -R nvauser:nvbgroup /var/opt/nevisreports-es/default
- Enable the nevisreports-es system service:
systemctl enable nevisreports-es.service
- Start the nevisreports-es default service:
systemctl start nevisreports-es.service
- Deploy both the standard and custom es-scripts, by running the following command:
nevisreports-es deploy-installed-es-scripts
- Check the status of the service:
systemctl status nevisreports-es
- Perform the following simple test to check that the service is properly started:
curl -XGET localhost:9200
- After successfully upgrading nevisreports-es, you can perform the data migration. For more information, see the chapter Data migration.
Enable nevisreports-es to access the old cluster (6.2.x), by adding the old cluster to reindex.remote.whitelist in the elasticsearch.yml file, under /var/opt/nevisreports-es/default/config: reindex.remote.whitelist:localhost:9200
nevisreports-ls
- Set the JAVA_HOME path:
JAVA_HOME=<put-your-path>
export JAVA_HOME
Be sure to set the JAVA_HOME variable with the correct JDK path, before running the nevisreports-lscommands. Never set the JAVA_HOME variable with a JRE path. 2. Verify the version of the installed nevisreports-ls with the following command:
nevisreports-ls pkg # shows the nevisreports-ls package version
- Rename /var/opt/nevisreports-ls to /var/opt/nevisreports-ls-4.3.0:
mv /var/opt/nevisreports-ls /var/opt/nevisreports-ls-4.3.0
- Copy the properties template file to the /tmp directory. Perform the required changes to the properties file or manually merge previous configurations:
cp /opt/nevisreports-ls/templates/config/nevisreports-ls.properties /tmp/
- Create a default instance of nevisreports-ls by running the following command:
nevisreports-ls inst create /tmp/nevisreports-ls.properties
- Copy the custom events configurations and filter files, by executing the following command:
cp -r /var/opt/nevisreports-ls-4.3.0/default/templates/custom/logstash.d/* /var/opt/nevisreports-ls/default/templates/custom/logstash.d/
Note that the Elasticsearch mapping removed the "doc" type/level. Also, the mapping validation has become stricter for dynamic templates. See also `http://www.elastic.co/guide/en/elasticsearch/reference/7.9/breaking-changes-7.7.html#stricter-mapping-validation. 7. Deploy both the standard and the custom configurations, with the following command:
nevisreports-ls deploy-logstash-configs
- Enable the events system services:
systemctl enable [email protected]
- Start the events system services:
systemctl start nevisreports-ls@events
- Check the status of the events system services:
systemctl status nevisreports-ls@events
- To view the complete logs of the events services, run the following command:
journalctl -u nevisreports-ls@events
- Check that the service has properly started by executing the following test:
netstat -nltp # check for port 5044(default port for events service)
- Remove the /var/opt/nevisreports-ls-4.3.0 directory:
rm -rf /var/opt/nevisreports-ls-4.3.0
nevisreports
- Set the JAVA_HOME path:
JAVA_HOME=<put-your-path>
export JAVA_HOME
Be sure to set the JAVA_HOME variable with the correct JDK path, before running the nevisreportscommands. Never set the JAVA_HOME variable with a JRE path. 2. Verify which version of nevisReports is installed:
# shows the nevisReports package version
nevisreports pkg
- Create a backup of the repository database, if there are any database changes between the previously installed version and the current version (refer to the release notes for that information).
- For Oracle, contact the database administrator for help.
- For MySQL, use the mysqldump utility or contact the database administrator for help.
- Stop the nevisReports server if it is already running:
nevisreports stop
- Change the value of the property appServertype to "wildfly" in the /var/opt/nevisreports/jrs/conf/nevisreports.properties file.
appServertype=wildfly
- Upgrade the nevisReports instance to the latest version:
nevisreports upgrade
- After a successful upgrade, the nevisReports application, Elasticsearch and Logstash should be up and running. Check if all services have started by executing the following commands:
# for JRS application status
nevisreports status
# for Elasticsearch
systemctl status nevisreports-es

# For Logstash instances
systemctl status nevisreports-ls@events
If there are any problems with these servers, check the log files for errors. 8. Log in to the JasperReports Server web application to check that everything is working as expected. 9. Check for and remove any legacy reports:
- In the user interface, go to View > Repository:
Check whether the legacy reports have been removed.
Legacy reports
The following reports are legacy reports:
- Dormant Authorizations report
- ACAA Overview report
- Select each still existing legacy report and delete it by clicking on Delete.
Filebeat 7.9 Upgrade
After upgrading the appliance, make the following changes to the filebeat.yml file.
- Changed prospectors to inputs(
<http://www.elastic.co/guide/en/beats/libbeat/current/release-notes-6.3.0.html/>).
The handling of the host field has changed from Filebeat version 6.6 onwards. See the processors section in the example below to handle the host field correctly.
nevisIDM might change the default event log file from nevisidm-events.log to audit.log if you deploy via nevisAdmin4.
Sample: filebeat.yml version 7.9.x
filebeat:
 inputs:
 -
 paths: /var/opt/nevisproxy/*/log*/*-events.log*
 exclude_files: ['\.gz$']
 fields_under_root: true
 fields:
 type: "nevisproxy-events"
 -
 paths: /var/opt/nevisauth/*/log*/*-events.log*
 exclude_files: ['\.gz$']
 fields_under_root: true
 fields:
 type: "nevisauth-events"
 -
 paths: /var/opt/nevisidm/*/log/audit.log*
 exclude_files: ['\.gz$']
 fields_under_root: true
 fields:
 type: "nevisidm-events"

processors:
- rename.fields:
 - from: "host.name"
 to: "tempHost"
- drop_fields.fields:
 - "host"
- rename.fields:
 - from: "tempHost"
 to: "host"
output:
 logstash:
 hosts: <fqdn-of-nevisreports-host>:5044
 # To secure log transfer with TLS see chapter "Securing log transfer with TLS"
 # ssl.certificate_authorities: /var/opt/neviskeybox/<instance>/<slot>/truststore/<name>.pem
logging:
 to_files: true
 files:
 path: /var/log/filebeat
 name: filebeat.log
 rotateeverybytes: 10485760 # = 10MB
 keepfiles: 7
 level: error
Administration
After you have successfully installed nevisReports, you can configure various aspects of the system in more detail. This chapter describes some advanced administration topics.
Archiving logs in a centralized location
We recommend keeping a copy of logged events in a centralized location outside of the Elasticsearch database, to fulfill the following requirements:
- Long-term availability of ).
Event logs are highly compressible. Archive logs are usually over 10 times smaller than the corresponding database index files.
- Possibility of data recovery from a backup copy of logged events, in the case of loss of database index files or file corruption.
- Vendor-independent access to log files. Archive logs are in json format. This means that archive logs are human-readable and can be accessed by various tools. There is no need for an Elasticsearch installation to process them.
It is possible to write archive logs to any mounted file system on the nevisReports server machine where Logstash is available. See the next section how to configure archive logs.
Configuring archive logs
To turn on the writing of compressed archive logs, do the following:
- Create the following Logstash configuration file:
/var/opt/nevisreports-ls/default/logstash.d/40-output-local-files.conf
output {
 if ![@metadata][isClone] {
 file {
 path => "/var/opt/log/nevis/%{host}/%{comp}/%{[@metadata][type]}/%{instance}.%{+YYYY-MM-dd}.log.gz"
 message_format => "%{[@metadata][message]}"
 gzip => true
 flush_interval => 2
 }
 }
}
The meaning of flush_interval
The code snippet flush_interval => 2 means that pending archive log events are flushed to disk only, if two seconds have passed after the last and the new event. On most production systems, this behavior is fine, since new events will arrive at a steady rate. However, in the unlikely case that the event flow slows down remarkably or stops completely, no flushing will occur even after two seconds have passed. To make sure that logs are always written immediately, set flush_interval to 0. However, we do not recommend this setting as it may have a noticeable performance impact on some systems. 2. To match your directory layout, you can modify the beginning of the path (/var/opt/log/nevis) in the snippet above. Make sure that the directory exists and is writable for the Logstash process, for example as follows:
mkdir -p /var/opt/log/nevis
chown nvauser:nvbgroup /var/opt/log/nevis
- The pattern YYYY-MM-dd means that a new log file is created for every new day. If you prefer an hourly rotation, change the pattern to YYYY-MM-dd-HH. For further options, see the official elastic documentation.
As soon as the system processes events, it will create log files in the location referred to by the given path. The subdirectories for host, comp, and so on will be created automatically. Log rotation is done when the system receives an event with a time stamp leading to a different file pattern. For example, if events are received on Sep 1, 2015 and on Sep 3, 2015, two (not three) log files will be created: one for Sep 1, one for Sep 3, and no file for Sep 2.
4. Restart Logstash with the command below.
### systemctl restart nevisreports-ls@events
Restoring archive logs into Elasticsearch
This section explains how to restore previously archived json event logs into Elasticsearch. This might be necessary, for example, if you need to create reports on data that has been deleted from the index ).
Before you start the restore process:
- define the time frame for which logs need to be made available for reporting,
- decide in which location you want to temporarily store the uncompressed archive logs (e.g., /tmp/restore-archive-logs
).
Then, perform the following steps on the nevisReports appliance (virtual) machine:
Turn off the automatic deletion of old index files ).
Determine which archive log files you need to re-import into the system:
Run the following command to display the list of monthly indices that Elasticsearch still has available:
curl -s http://localhost:9200/_cat/indices?v | grep 'events-' | sort | awk '{print $3}'Read and interpret the result list. For example, an index containing the text "2016.01" applies to January 2016, "2016.02" to February, and so on.
Compare the time indications of the indices in the list with the desired reporting time frame, to find out which monthly indices are missing and need to be re-created.
Copy the logs that you need to restore to a temporary location. For each missing month, adapt the
--includepattern in the following command and execute it:
rsync -av /var/opt/log/nevis/ /tmp/restore-archive-logs --include="*.2016-01-*.log.gz" --include="*/" --exclude="*"
Ensure that there is enough space for the nevisReports appliance to hold the uncompressed files and for Elasticsearch to hold the restored data:
Get the total compressed size of the logs in the temporary location:
du -sh /tmp/restore-archive-logsDuring the re-importing process, you may temporarily need 20 times, or more, of the total compressed size.
- Uncompressed logs need approximately 10 times more disk space than compressed ones.
- Furthermore, as a rule of thumb, logs in the Elasticsearch index occupy the same amount of disk space as the uncompressed logs.
- Uncompress the log files:
find /tmp/restore-archive-logs -name '*.gz' -exec sh -c 'zcat -q {} >{}.uncompressed' ';'
The zcat command may report unexpected end of file. This indicates that the file has not been flushed by Logstash yet. Wait until new events arrive, or consider restarting Logstash and Elasticsearch via /etc/init.d/elastics resta 6. Make a temporary copy of your complete Logstash configuration directory:
cp -r /var/opt/nevisreports-ls/default/logstash.d /tmp/logstash-restore.d
- Remove unneeded Logstash input and output configuration files.
This step assumes that your original Logstash configuration follows the recommended structure ).
rm -f /tmp/logstash-restore.d/0*.conf /tmp/logstash-restore.d/40-output-local-files.conf
40-output-local-files.conf is deleted to avoid that re-imported logs are archived again. 8. Add the following Logstash configuration file:
/tmp/logstash-restore.d/00-input-archive.conf
input {
 file {
 path => "/tmp/restore-archive-logs/*/*/*/*.log.gz.uncompressed"
 start_position => "beginning"
 sincedb_path => "/tmp/logstash-restore.sincedb"
 }
}
### Decode metadata fields from log file field and drop the path field
filter {
 mutate {
 # host field must not contain the nevisReports appliance where archives restore process is performed
 remove_field => [ "host" ]
 }
 grok {
 match => [
 "path", "^/tmp/restore-archive-logs/%{NVDIR:host}/%{NVDIR:comp}/%{NVDIR:type}/%{NVDIR:instance}\.\d\d\d\d-\d\d-\d\d\.log.gz.uncompressed$"
 ]
 remove_field => [ "path" ]
 }
}
The file input plug-in reads all files in parallel. When you have many thousands of uncompressed log files, you may need to run Logstash multiple times with adapted path settings. 9. Run Logstash with the temporary configuration directory:
JAVA_HOME=`ls -1d /etc/alternatives/java_sdk_* 2>/dev/null | tail -1`
export JAVA_HOME
PATH=$PATH:${JAVA_HOME}/bin
LS_HEAP_SIZE=1g

rm -f /tmp/logstash-restore.sincedb
cd /tmp/logstash-restore.d
/opt/elasticsearch/logstash/bin/logstash -f /tmp/logstash-restore.d
- While Logstash is running, display the contents of the file /tmp/logstash-restore.sincedb to monitor its progress.
- Logstash does not stop when finished. If you are not running low on system resources, it should be safe to stop Logstash some minutes after there have been no updates anymore to the sincedb file.
- Verify that there is no data gap anymore by again displaying the list of monthly indices. Additionally, you can run the following query command to display the timestamp of the newest event in a given month:
curl -s -XPOST 'localhost:9200/events-2016.01/_search?pretty' -d '{ "query": { "match_all": {} }, "_source": "@timestamp", "size": 1, "sort": [ { "@timestamp": { "order": "desc" } } ] }' |grep timestamp
When loading a large amount of archive logs, Elasticsearch will need significant time to index all events. A simple way to monitor this is to keep an eye on the CPU usage of the Elasticsearch Java process: When the indexing is complete, CPU usage will come down to the normal level. 11. Delete the uncompressed log files and the Logstash restore configuration:
rm -rf /tmp/archive-logs /tmp/logstash-restore.d /tmp/logstash-restore.sincedb
- Run the needed reports.
- Turn on the cron job that performs automatic deletion of old index files ). When the job runs, the re-imported data will be deleted again.
Deleting log data from Elasticsearch
By default, the system stores events (log lines) collected for nevisReports in one Elasticsearch index per month. These indices are never deleted (by default).
To save space and improve performance, we recommend deleting old indices on a regular basis. It depends on your reporting requirements how often you should delete data and how much data you should keep. The default reports work well when at least two months of data are available.
Suppose you want to keep data of the current month and the three preceding months. This means that you need to delete all but the four most recently added indices. To do so, perform the following steps:
- Run the following commands on the nevisAppliance:
elasticsearch-remove-old-indices -i 4 -g events
- To repeat these commands on a regular basis, you have to add a cron job. By means of the sample cron job below, the system will run the command on the second day of every month and log the actions:
Sample setting within /var/spool/cron/nvluser
0 5 2 * * /usr/local/bin/elasticsearch-remove-old-indices -i 4 -g events -o /var/opt/nevisreports-es/default/log/elasticsearch-remove-old-events-indices.log
- For further options, run elasticsearch-remove-old-indices.sh -h.
Explanation of the Logstash configuration structure
This chapter explains the organization of the Logstash configuration directory and how this directory is managed by the nevisreports-ls command wrapper.
The following is an overview of a fully deployed Logstash configuration directory:
/var/opt/nevisreports-ls/default/logstash.d
The first three directories contain supporting files that cannot be changed. The last directory, /events, contains configuration files to start up Logstash instances. The nevisReports server only runs one type of Logstash instances: events.The/eventsdirectories contain configurations for the events instance. When a Logstash instance is started, files within the instance directory are processed in alphabetical order, similar to the output of the Unix command ls. Logstash requires the input, filter and output directives to appear in this exact order. The following code block gives an example of an events instance configuration directory:
Example: excerpt of "ls -l /var/opt/nevisreports-ls/default/logstash.d/events"
### custom inputs / custom "pre"-filters
00-input-beats.conf -> /var/opt/nevisreports-ls/default/logstash.d/events/00-input-beats.conf

### standard filters
10-filter-nevisproxy-events.conf -> /opt/nevisreports-ls/templates/logstash.d/events/10-filter-nevisproxy-events.conf
11-filter-nevisauth-events.conf -> /opt/nevisreports-ls/templates/logstash.d/events/11-filter-nevisauth-events.conf
19-filter-cleanup.conf -> /opt/nevisreports-ls/templates/logstash.d/events/19-filter-cleanup.conf

### custom "post"-filters: can add data inside the custom blocks
### none in this setup
### example: 20-filter-myproject-custom.conf

### outputs
30-output-nevisproxy-events.conf -> /opt/nevisreports-ls/templates/logstash.d/events/30-output-nevisproxy-events.conf
31-output-nevisauth-events.conf -> /opt/nevisreports-ls/templates/logstash.d/events/31-output-nevisauth-events.conf

### custom outputs
40-output-local-files.conf -> /var/opt/nevisreports-ls/default/templates/custom/logstash.d/events/40-output-local-files.conf
Note: Files that start with the numbers 1 or 3 represent core functionality and should not be changed. However, you can add custom configuration files to be in line with customer environments and to fulfill customer-specific requirements. The order of the configuration files matters and you should name your configuration file accordingly:
- Start with 0: for custom inputs and custom "pre"-filters
- Start with 2: for custom "post"-filters, for example to add more fields to custom blocks
- Start with 4: for custom outputs, for example to output log events to files for backup
Since there is a mix of standard and custom files in a single directory, the deployment of files into this directory is controlled using the nevisreports-lsdeploy-logstash-configs**command. See the next chapter for more information.
Deploying Logstash configurations
Deployment of configuration files into the /var/opt/nevisreports-ls/default/logstash.d directory is managed by the nevisreports-lsdeploy-logstash-configs*command. Use it to indirectly deploy Logstash configurations instead of directly manipulating the directory. The deploy-logstash-configs* target works as follows:
- nevisReports standard configuration files are pre-installed in the following directories: /opt/nevisreports-ls/templates/logstash.d/events
- Your custom configuration files are to be deployed into the following directories: /var/opt/nevisreports-ls/default/logstash.d/events
- You can configure the following selector properties to control which standard configuration files should be deployed. Or you can set an empty value to completely disable all standard configurations:
/var/opt/nevisreports/jrs/conf/nevisreports.properties
nevis.reports.include-standard-logstash-events-confs=*
When invoked, nevisreports-ls deploy-logstash-configs will
- remove any existing directory in /var/opt/nevisreports-ls/default/logstash.d,
- create a directory in /var/opt/nevisreports-ls/default/logstash.d, and
- deploy configuration files in /var/opt/../events from /opt/../events**.
Custom Logstash mapping configuration
The events Logstash instances allow the application mapping configuration to be customized. These configuration files map servlet names configured in nevisProxy to application display names. The display names are the ones that will appear in various nevisReports standard reports and on the dashboard. The defaults included in nevisReports assume a standard Nevis installation and configuration via nevisAdmin. If these naming rules are followed, the default nevisReports mapping configuration will already work.
It is recommended to follow the nevisAdmin servlet naming convention for custom servlet mappings and configurations. This requires no additional mapping configuration changes in nevisReports.
The nevisAdmin servlet naming convention in detail: ServletYourAppName001
- Servlet is a fixed prefix and removed by nevisReports.
- 001 is a number added by nevisAdmin to identify multiple app servers for the same application in load balancing scenarios. This is also removed by nevisReports.
- YourAppName is by default the resulting application name mapped by nevisReports. It cannot contain numbers at the end of the application name (i.e., ServletMagic24001 would result in Magic only). Best practices for application name mappings
Application name mapping configuration has significant impact on report data output. Not only it is responsible for display names shown in reports, but it is also essential to detect dormant authorizations. Misconfiguration of mappings will result in incorrect dormant reports and charts.
Disjoint namespaces between nevisProxy and nevisIDM
Detecting dormant authorizations requires a correlation of data produced by nevisProxy and nevisIDM. The former tells us which authorization is used when, and the latter tells us which authorization is granted when. However, the required data, in the form of nevisProxy servlet names and nevisIDM application names, lives in two disjoint systems. Therefore, to correlate nevisProxy servlets with nevisIDM applications, the names must be brought together to a single unified namespace. Application name mapping configurations are nevisReports' solution to this problem.
nevisReports ships with a default application mapping configuration, which will work for standard nevisAdmin-based installations, i.e., as long as you configure application names in your nevisAdmin to be the same (case-sensitive) as those in nevisIDM, the default mapping will take care of matching the two for report event processing. If your installation is different, i.e., you do not use the same naming convention as the nevisAdmin configuration generator, you will need to define a custom mapping.
Depending on which solution you choose to use, bear in mind the following best practices:
Best practices for default mapping
- Use the same application name (case-sensitive) in both nevisAdmin and nevisIDM.
- Once live in production, do not change the names of existing applications in either system.
- Over time, new applications may be added and existing applications may be removed without any ill effect – provided the first rule is followed.
Best practices for custom mapping
- The basic rule is that if a nevisProxy servlet and a nevisIDM application represents the same back-end application, the post-mapping names of both must converge to a single value (case-sensitive).
- Once live in production, do not change, existing nevisProxy servlet names, existing nevisIDM application names or their mappings in nevisReports.
- If a new application is added to the system, add its mapping to nevisReports at the same time as you would add it to nevisProxy and nevisIDM.
- If an existing application is removed from the system, do not remove its mapping from nevisReports because past data remaining in nevisReports still requires it.
Mapping errors
If there is a mapping error, the consequences will be as follows. Imagine an application XYZ is mapped incorrectly,
- nevisIDM reports that user ABC has been granted authorization to application XYZ at a certain date T1.
- User ABC actively accesses it every day and nevisProxy reports the access events accordingly.
- However, nevisProxy access events are not correlated to application XYZ due to wrong mapping.
- As a result, the authorization to application XYZ of the user ABC appears to not have been used at all.
- The authorization will be wrongly reported as dormant (after sufficient time has elapsed since T1).
Deploying configuration changes
- Set the JAVA_HOME path:
JAVA_HOME=<put-your-path>
export JAVA_HOME
Be sure to set the JAVA_HOME variable with the correct JDK path, before running the nevisreports-ls commands. Never set the JAVA_HOME variable with a JRE path. 2. After any changes to the Logstash configuration, they must be deployed by running the following command:
nevisreports-ls redeploy
- This automatically restarts all Logstash events instances. Check the status of the Logstash instances by running the following command:
Logstash events instance
### systemctl status nevisreports-ls@events
● [email protected] - "nevisreports-ls events service instance"
 Loaded: loaded (/usr/lib/systemd/system/[email protected]; enabled; vendor preset: disabled)
 Active: active (running) since Mon 2017-10-16 04:29:47 SGT; 14h ago
 Main PID: 1174 (java)
 Tasks: 23 (limit: 512)
 CGroup: /system.slice/system-nevisreports\x2dls.slice/[email protected]
 └─1174 /opt/adnjdk18/bin/java -XX:+UseParNewGC -XX:+UseConcMarkSweepGC -Djava.awt.headless=true -XX:CMSInitiatingOccupancyFraction=75 -XX:+UseCMSInitiatingOccupancyOnly -XX:+HeapDumpOnOutOfMemoryEr...

Oct 16 04:29:47 linux systemd[1]: Started "nevisreports-ls events service instance".
Oct 16 04:31:01 linux logstash[1174]: {:timestamp=>"2017-10-16T04:31:01.861000+0800", :message=>"Pipeline main started"}
Events mapping
- Copy the default application name mapping template.
cp /opt/nevisreports-ls/templates/logstash-templates/20-filter-application.conf /var/opt/nevisreports-ls/default/templates/custom/logstash.d/events/20-filter-application.conf
- The template file you just copied contains default mappings that should work for nevisAdmin-based deployments. Refer to the Logstash documentation for the syntax of the mapping files. If you do not use nevisAdmin, define your own custom mappings in the following section:
20-filter-application.conf
##### configure the following section. Ignore other sections ###
 if [type] == "nevisproxy-events" {
 ...
 }
- Deploy the changes and check the log file for errors:
nevisreports-ls deploy-logstash-configs
Memory settings of Logstash Elasticsearch and JRS
This section explains how to change the Java memory settings for each component. The default settings should work well for the minimum and recommended overall memory values documented in chapter System requirements. Change the defaults only in case your environment does not run well with the default settings, for example, if you are getting out of memory exceptions or observe slow performance due to heavy garbage collection activities by the JVM.
In demanding setups, it may be nontrivial to allocate the right amount of memory to each process. Contact Nevis in case you have questions about this.
All changes below are applied on the nevisReports (virtual) machine.
Review garbage collection logs first
Before changing memory settings for any component, analyze the garbage collection logs of your production system (or a test system with similar load). See the table below to find the log files for each component.
| Component | Path and file name pattern of garbage collection logs |
|---|---|
| Logstash | /var/opt/nevisreports-ls/default/log/logstash-gc.log.** |
| Elasticsearch | /var/opt/nevisreports-es/default/log/elasticsearch-gc.log.** |
| JRS | /var/opt/adnwildfly/instances/jrs/log/server-gc.log.** |
Logstash memory settings
- In the file /var/opt/nevisreports-ls/default/config/events/jvm.options, change the -Xms and -Xmx parameters, for example from 1g to 2g. This allocates at most 2 GB of RAM to the process.
The specified value must be in line with the format accepted by the -Xmx parameter of the Oracle java command.
### heap sizing
-Xms1024m
-Xmx2048m
- Restart Logstash as follows:
### systemctl restart nevisreports-ls@events
Elasticsearch memory settings
- In the file /var/opt/nevisreports-es/default/config/jvm.options, change the -Xms and -Xmx parameters, for example from 4g to 6g. This allocates at most 6 GB of RAM to the process. Default heap size is 1gb.
The specified value must be in line with the format accepted by the -Xmx parameter of the Oracle java command.
### Xms represents the initial size of total heap space
### Xmx represents the maximum size of total heap space

-Xms4g
-Xmx6g
- Restart Elasticsearch as follows:
### systemctl restart nevisreports-es
Reserve free memory for Elasticsearch
Elasticsearch works best if the operating system has plenty of free RAM, which is automatically used to buffer the Elasticsearch database index files. Therefore, always make sure that you have many gigabytes of free RAM (including buffers) that will not be allocated by any process. For more information on Elasticsearch memory tuning, see the Elasticsearch documentation. For example, Heap: Sizing and Swapping and the blog article about Managing Elasticsearch's Managed Heap are good starting points.
JRS memory settings
- Edit the file /var/opt/adnwildfly/instances/jrs/standalone/configuration/vmargs.conf.
- Find the line shown in the next code block and update the value, for example from 2048m to 3072m.
The specified value must be in line with the format accepted by the -Xms and -Xmx parameters of the Oracle java command.
### heap sizing
-Xms2048m
-Xmx3072m
- Restart JRS as follows:
nevisreports restart
Data re-index in Elasticsearch
This chapter explains how to use the nevisreports-es-reindex tool to perform smooth data migration in Elasticsearch. This tool mainly migrates/re-indexes event indices from an older cluster (1.x.x or 2.4.x) to a new cluster (6.7.1).
Command Usage
- To find out the usage of the tool, run the following command:
nevisreports-es-reindex
- To re-index all event indices, run the following command:
nevisreports-es-reindex old-prod-inst:9200 new-prod-inst:9200
- To re-index a selected list of event indices, execute this command:
nevisreports-es-reindex old-prod-inst:9200 new-prod-inst:9200 -E "events-2018.01 events-2018.02 events-2018.03"
Usage
Reindex from remote, to migrate indices from your old cluster to a new 6.x cluster. This
enables you to move to a 6.x cluster from a pre-5.6 cluster without interrupting service.

USAGE: ./nevisreports-es-reindex <<sourcehost:port>> <<targethost:port>> -E "<<index1>> <<index2>> <<index3>>"

EXAMPLES:
###1
 ./nevisreports-es-reindex prod-inst-01:9200 prod-inst-02:9200

 Connects to the source elasticsearch (http://<<sourcehost:9200>>), gets a list of indices, migrates the indices and
 documents to the target elasticsearch (http://<<targethost:9200>>)
###2
 ./nevisreports-es-reindex prod-inst-01:9200 prod-inst-02:9200 -E "events-2018-01 events-2018-02"

 Connects to the source elasticsearch (http://<<sourcehost:9200>>), migrates event indices and documents to the target
 elasticsearch http://<<targethost:9200) as listed in the argument
###3
 ./nevisreports-es-reindex prod-inst-01:9200 prod-inst-02:9200 -S "events-2018-02"

 Connects to the source elasticsearch (http://<<sourcehost:9200>>), migrates indices and documents to the target
 elasticsearch http://<<targethost:9200) as listed in the argument

NOTE:
 For more details refer to the nevisreports reference guide.
Operation
Backup and recovery
A nevisReports appliance contains configuration and various kinds of data that must be backed up.
Configuration backup and recovery
The chapter "Backup and Recovery" in the nevisAppliance reference guide describes the backup and recovery of the configuration. This includes Logstash, Elasticsearch and nevisReports configurations (see below for information on backing up Elasticsearch indices).
Data backup and recovery
A nevisReports appliance typically contains data from various components that must be backed up.
Elasticsearch indices
See the Elasticsearch documentation for index backup and restore instructions.
Index backups may take a lot of disk space. See Archiving logs in a centralized location for an alternative solution. Note that restoring the indices from archive logs will take significantly longer than restoring index backups.
JasperReports Server repository
The JasperReports Server repository contains report configurations, permissions, saved reports and other information.
- When using a local MySQL database, follow the steps defined in the nevisAppliance Reference Guide: Database Backup and Recovery.
- If you use an Oracle database, use standard Oracle backup procedures to create a consistent backup.
Restore the database as follows:
- Execute nevisreports stop
. - Restore the database using MySQL or Oracle tools, depending on the database used.
- Execute nevisreports start
.
Archive logs
If you want to back up the archive logs, you need to back up the directory where the archive logs are stored.
To restore the logs, put back the files – there are no application dependencies on these files. See Archiving logs in a centralized location for more information on how to restore archive logs.
Manual log shipping from sending hosts
The filebeat process should be running at all times on the sending hosts. If this process is down for a significant amount of time, log data generated during the downtime will not be shipped from the sending host to the Elasticsearch database. This chapter explains how to prepare your setup for such outages and how to perform manual log shipping to recover the unshipped data.
This chapter applies only to environments where reports must always cover the full set of event log data, even after unexpected outages. It does not apply to purely SQL-based reports, such as those showing data from the nevisIDM system.
- The instructions in this section apply to any situation where manual log shipping is desired, not just to the aforementioned use case of the Filebeat process going down.
- A note about reliability: Based on our experience, the Filebeat process is designed to be long-running and self-restarting. We have not seen any incident yet of an unexpectedly interrupted Filebeat process. However, the process breakdown could also be caused by human error (for example, misconfiguration by a maintenance engineer).
- Filebeat keeps track of the number of lines that have been read from each source log file. This happens in the following file: /var/lib/filebeat/registry Supporting configuration on the sending hosts
This section explains how to prepare your setup for outages.
Note that keeping event logs is the minimum configuration prepare in advance (at the time when you deploy your system). It is too late if you wait until you need to do a recovery.
Keeping event logs
Configure log rotation for the sending components in order for event logs to be kept long enough until you could perform a recovery.
Determine a suitable recovery guarantee duration for your deployment. A recovery guarantee duration is defined as the period of time for which a recovery must be guaranteed. For example, if you want to guarantee the recovery of logs created in the last 5 days, the recovery guarantee duration is 5 days.
Based on the estimated system load, calculate the size of logs that must be retained. For example, if you want to guarantee 5 days and you estimate that your nevisProxy instance will generate 1 GB of logs per day, the retention size required is 5 GB.
Configure the log rotation strategy of the sending component in a way that it satisfies the retention size requirement.
For nevisProxy, adapt the CustomLogsconfiguration ) for the nevisproxy-events.log so that it includes log rotation. An example can be found in the nevisProxy reference guide, chapter "Using the Apache CustomLog".
For nevisAuth, modify the configuration of the EVENTSappender. See Hosts running nevisAuth for details.
In high-volume environments, the retention size requirement may be large. Instead of configuring the log rotation strategy to enable large amounts of logs in the active log directory, you could also develop solutions to compress and move the log files to a different directory. Regardless of the strategy you choose, it is important that you satisfy your desired retention size requirement.
Setting up manual recovery directories
We assume that you use the nevisReports standard Filebeat configuration. To set up manual recovery directories, perform the following steps:
- Create the following directories to mirror original Nevis component log directories. Create as many as there are components and instances on the host. Later on, you store the manually recovered logs into the corresponding directories.
/var/log/recovery-logs/<component>/<instance>/log
Example
/var/log/recovery-logs/nevisproxy/proxy1/logs/
/var/log/recovery-logs/nevisproxy/proxy2/logs/
/var/log/recovery-logs/nevisauth/auth/log/
- Add the new log directories to the existing paths in the /etc/filebeat/filebeat.yml configuration as follows:
YAML is white-space- and indention-sensitive.
/etc/filebeat/filebeat.yml
filebeat:
  prospectors:
    -
      paths:
        - "/var/opt/nevis*/*/log*/*-events.log"
        - "/var/log/recovery-logs/nevisproxy/*/log*/*-events.log.*"
      fields:
        host: "<local-host-name>"
        type: "nevisproxy-events"
  output:
  logstash:
    hosts: ["<fqdn-of-nevisreports-host:5044"]
    tls:
      certificate_authorities: ["/var/opt/neviskeybox/<instance>/<slot>/truststore/<name>.pem"]

logging:
  to_files: true
  files:
    path: /var/log/filebeat
    name: filebeat.log
    rotateeverybytes: 10485760 # = 10MB
    keepfiles: 7
  level: error
Supporting configuration on the nevisReports appliance
To be able to recover log files, also prepare supporting configuration on the nevisReports appliance. Do the following:
- Add manual recovery file paths to the 00-input-beats.conf file (see the code block below).
/var/opt/elasticsearch/config/logstash.d/00-input-beats.conf
# Note: the filebeat configuration (on the sending host) must set the
# "type" field of each message to either "nevisproxy-events" or "nevisauth-events"
# for the event to be processed by the filters on the receiving host.
input {
  beats {
    port => 5044
    ssl_certificate => "/var/opt/neviskeybox/default/default/node_certificate.pem"
    ssl_key => "/var/opt/elasticsearch/config/node_key.pem"
  }
}
# Decode metadata fields from log file field
filter {
    grok {
      match => [
       "file", "/var/opt/%{NVDIR:comp}/%{NVDIR:instance}/logs/%{NVDIR:type}\.log",
       "file", "/var/opt/%{NVDIR:comp}/%{NVDIR:instance}/log/%{NVDIR:type}\.log",
       "file", "/var/log/recovery-logs/%{NVDIR:comp}/%{NVDIR:instance}/logs?/%{NVDIR:type}\.log\..*"
               ]
    }
    if ![comp] {
      mutate {
        add_field => [ "comp", "UNKNOWN" ]
      }
    }
    if ![instance] {
      mutate {
        add_field => [ "instance", "UNKNOWN" ]
      }
    }
    if ![type] {
      mutate {
        add_field => [ "type", "UNKNOWN" ]
      }
    }
}
Manual recovery steps
Overview
Manual recovery uses the same Beats transport mechanism as the live data flow. Therefore, in the case of a missing data incident, first restore the transport mechanism before you attempt to recover any past data.
The manual recovery process includes the following steps:
- Gathering information about the estimated downtime.
- Determining from which host, component and instance data is missing.
- Manually cutting and slicing the log files at the sending hosts to get back the missing data.
- Shipping the recovered log files by depositing them into the manual recovery directories you prepared in advance.
If you think it is necessary to perform the manual recovery process, pay attention to the following points:
- Multiple components could be sharing a host.
- There can be separate instances of the same component, either on the same host or on a different host (e.g., two separate nevisProxy instances).
- There can be redundant, disaster recovery setups (e.g., a load-balanced setup where the same logical instance is deployed on two separate machines).
Therefore, it is important to know from which hosts, from which components, and from which instancesyou need to recover data. For example, if you observe that Filebeat has gone down for a particular host, you need to recover logs from all components and instances that run on that host.
Follow the instructions described in the next sections.
Step 1: Gather information about the estimated downtime
From your monitoring server or otherwise, assess as accurately as possible the period of time for which recovery is needed (e.g., down from Sunday to Tuesday). This information is useful to narrow down the search later on.
Step 2: Determine host, component, and instance
As discussed above.
For each host, component, and instance, perform the next steps.
Step 3: Determine if Filebeat has recovered automatically
If Filebeat is down for a short time only, it can usually continue shipping log data without the need for manual steps. However, manual shipping is needed if the source JSON log files have been rotated during the downtime.
- In case Filebeat is still down, start it.
- Check the file /var/log/filebeat/filebeat.log on the host.
If the following text line appears for the log file of the instance (here
<LOG FILE NAME>), manual steps are not needed.
Update existing file for harvesting: <LOG FILE NAME>
- Otherwise (for example if you encounter messages like the following), continue with step 4.
Not resuming rotated file: <FILE NAME>
Harvester started for file: <FILE NAME>
Step 4: Manually slice log files and deposit them into recovery directories
Perform the following steps to extract the relevant log files from the sending host(s) and to deposit them into the recovery directories:
- Log in to the sending host.
- Manually extract logs for all missing months
- Store the logs in separate files.
- Give each log file an appropriate name (for example, nevisproxy-events.log.201602, nevisproxy-event.log.201603).
- Deposit the file(s) into the recovery directories that you prepared in advance. Make sure that you put them into the relevant directories (that is, those that correspond with the right component and instance). For example, if you are recovering log files for the nevisProxy instance named proxy1, you should deposit the recovered log files into /var/log/recovery-logs/nevisProxy/proxy1/logs.
- Now, Filebeat will automatically start shipping the logs. When you are sure that all files have been shipped, you can remove the files from the directories.
Elasticsearch and Logstash maintenance
Status and log files
Run the following command to view the status of the Elasticsearch processes and their log file locations:
### systemctl status nevisreports-es
Run the next commands to view the status of the Logstash services:
### systemctl status nevisreports-ls@events
Stopping and starting
Run the following commands to control the Elasticsearch process:
# systemctl stop nevisreports-es
# systemctl start nevisreports-es
# systemctl status nevisreports-es
Run the next commands to control the Logstash process:
# systemctl stop nevisreports-ls@events
# systemctl start nevisreports-ls@events
# systemctl status nevisreports-ls@events
Retrieving index statistics
Elasticsearch gathers various statistics about its indices. For example, to display the number of documents that the indices contain as well as the disk space usage, run the following command on the nevisReports appliance:
curl localhost:9200/events*/_stats/docs,store?pretty
You can find further options in the Elasticsearch documentation.
Deleting old log data
To delete data that is no longer needed, see Deleting log data from Elasticsearch.
Restoring archive logs into Elasticsearch
In some cases, it may be necessary to restore archived json event logs into Elasticsearch, e.g., if you need to create reports on data that has been deleted from the index.
See Archiving logs in a centralized location for instructions on how to create and restore archive logs.
JasperReports Server maintenance
Status and log files
Run the following command to view the JRS process status and log file location:
nevisreports status
Stopping and starting
Run the following commands on the nevisReports appliance to control the JRS web application:
nevisreports stop
nevisreports start
nevisreports restart
Displaying a diagnostic snapshot of the server
To display a report containing the current status of the nevisReports web application, do the following:
- Log in to your server with the superuser account.
- Display the library and access the Diagostic Report.
- Alternatively, you can visit this URL:
https://<FQDN_OF_NEVISREPORTS_HOST>:8777/nevisreports/flow.html?_flowId=viewReportFlow&reportUnit=%2Fpublic%2Fdiagnostic%2FJSDiagnosticReport.
Addendum A - Glossary
Defines the terms used in the nevisReports reference and development guide.
| Entity | Definition |
|---|---|
| ACAA | The ACAA (Adaptive Context-Aware Authentication) module is an extension for nevisAuth to evaluate and asses historic information during each login. |
| App server | Hosts one or more applications (virtual or physical hardware). |
| Application | Business applicationFor example, web mail or shopping application. |
| Attack | See threat. |
| Beats | Beats is the platform for single-purpose data shippers. They install as lightweight agents and send data from hundreds or thousands of machines to Logstash or Elasticsearch. The nevisAppliance has filebeat installed by default to ship the logfiles to nevisReports. |
| Catalog | JasperReports zip file which contain JasperReports artifacts like JRXML, images, jars, etc. |
| ElasticElastic Stack (ELK Stack) | Elastic is the company behind the open-source products Elasticsearch, Logstash, Kibana and Beats. Elastic Stack (previously known as ELK Stack) is the combination of Elasticsearch (as a datastore), Logstash (as data ingester / transformer) and Kibana (as visualizer). nevisReports is based on the Elastic Stack, see Architecture Overview for details. |
| Elasticsearch | Elasticsearch is a distributed, RESTful search and analytics engine capable of solving a growing number of use cases. As the heart of the Elastic Stack, it centrally stores your data so you can discover the expected and uncover the unexpected. It is used by nevisReports to store event and stats data. |
| Filebeat | A data shipper that operates on files, part of the Beats platform. Installed by default on all nevisAppliance images to send logfiles to nevisReports. |
| Host | DNS domain name visible to end users inside the web browser. |
| JasperReports | An open-source technology toolkit in Java to build reports from a variety of datasources. It also specifies an XML description language (JRXML) to write reports and their formatting the outputs. |
| JasperReports Server (JRS) | A server component from TIBCO to run and manage JasperReports in a web application, including Dashboards, management and scheduled reports. The web frontend of nevisReports is built on top of JasperReports Server Pro. |
| Jaspersoft | See TIBCO. |
| JRXML | The XML description language to write JasperReports in. See JasperReports. |
| Logstash | Logstash is an open source, server-side data processing pipeline that ingests data from a multitude of sources simultaneously, transforms it, and then sends it to Elasticsearch. |
| Nevis component | The Nevis Security Suite consists of several products and components. Nevis components offer more functionality for one or several Nevis products, but are not stand-alone products themselves, such as nevisLogRend, nevisMeta, nevisWorkflow, nevisDataPorter, nevisAgent, nevisKeybox, and nevisCred. |
| Nevis product | The Nevis Security Suite consists of five products and several components. The five products are nevisProxy, nevisAuth, nevisIDM, nevisReports and nevisAdmin. Each product performs specific tasks and has dedicated features within Nevis and can be purchased and maintained as a stand-alone solution (except for nevisAdmin). |
| Nevis environment | A set of connected Nevis products and components (in one stage, e.g. production). For example, a number of nevisProxy, nevisAuth, nevisIDM instances installed on various servers, which work together to provide WAF and IAM functionality. |
| (Nevis) server | (Virtual) machine hosting one or more Nevis products and components. |
| Request | HTTP request processed by a nevisProxy instance, often passed on through an application. |
| Tenant | Also called client in nevisIDM. To avoid confusion with other uses of client (for e.g., browser or end user), in nevisReports this is called tenant. |
| Threat | A potentially malicious request that was detected and mitigated by nevisProxy or other Nevis components (e.g. ACAA). |
| TIBCO | The company behind JasperReports Server and Jaspersoft Studio Pro. nevisReports is based on their commercial JasperReports Server Pro product. |
| Traffic | Data volume processed by nevisProxy instances. |
| User | End user accessing applications or authenticating via Nevis. |