Monitoring setup on Kubernetes
This tutorial guides you through the process of installing a sample monitoring setup on Kubernetes using OpenTelemetry that can be used together with the Observability patterns provided by nevisAdmin 4.
The configuration presented here is intended to be used with Product Analytics, and stores all data for 24 hours.
Prerequisites
- Have an existing Kubernetes cluster and have enough permissions to create cluster scoped resources and namespaces.
- Ensure the following software is pre-installed:
- kubectl: Kubernetes command line interface.
- helm: Helm CLI
Infrastructure
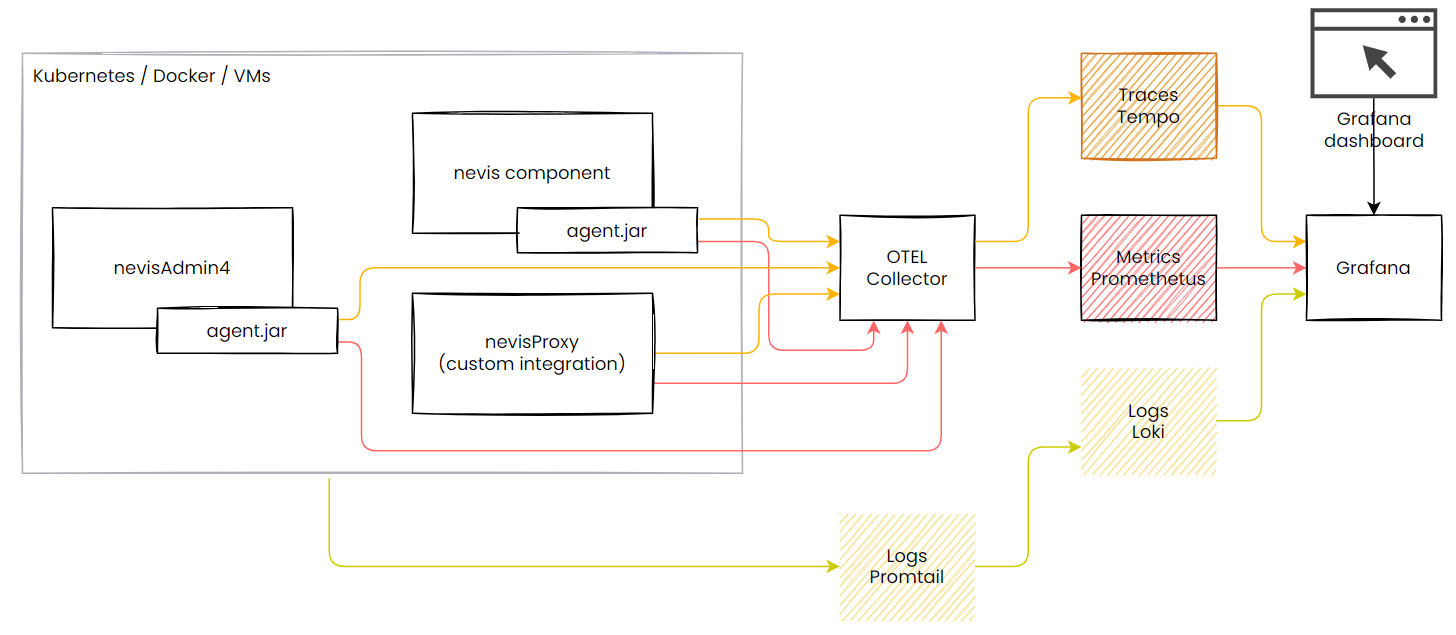
- Grafana Loki is used to store the logs of the Nevis components.
- Promtail is an agent which ships the gathered logs to the Grafana Loki instance.
- Grafana Tempo is a tracing backend. It's used to ingest the traces gathered by the OpenTelemetry Collector.
- Prometheus is used to ingest the metrics gathered by the OpenTelemetry Collector.
- OpenTelemetry Collector receives metrics and traces from the Nevis components using the Observability patterns and forwards them to Prometheus and Tempo.
- Grafana provides visualization for the gathered metrics, traces and logs.
Installation
Grafana Loki
Use the following values file for the installation.
loki-values.yaml
loki:
  gateway:
    enabled: true
    basicAuth:
      enabled: false
  auth_enabled: false
  schemaConfig:
    configs:
      - from: 2024-04-01
        object_store: filesystem
        store: tsdb
        schema: v13
        index:
          prefix: index_
          period: 24h
  compactor:
    retention_enabled: true
    delete_request_store: filesystem
  limits_config:
    retention_period: 24h
    max_cache_freshness_per_query: 10m
    query_timeout: 300s
    reject_old_samples: true
    reject_old_samples_max_age: 24h
    split_queries_by_interval: 15m
  commonConfig:
    replication_factor: 1
  storage:
    type: 'filesystem'
singleBinary:
  persistence:
    enabled: true
    size: 50Gi
  replicas: 1
deploymentMode: SingleBinary
backend:
  replicas: 0
read:
  replicas: 0
write:
  replicas: 0
chunksCache:
  enabled: false
resultsCache:
  enabled: false
helm repo add grafana https://grafana.github.io/helm-charts
helm repo update
helm upgrade --install loki grafana/loki --namespace observability --create-namespace --version v6.2.0 -f loki-values.yaml
Promtail
Use the following values file for the installation.
promtail-values.yaml
config:
  snippets:
    pipelineStages:
      - match:
          selector: '{app!~"nevis.*"}'
          action: drop
          drop_counter_reason: not_nevis_log
helm repo add grafana https://grafana.github.io/helm-charts
helm repo update
helm upgrade --install promtail grafana/promtail --namespace observability --create-namespace --version v6.15.5 -f promtail-values.yaml
Prometheus
Use the following values file for the installation.
prometheus-values.yaml
alertmanager:
  enabled: true
kube-state-metrics:
  enabled: true
prometheus-node-exporter:
  enabled: true
prometheus-pushgateway:
  enabled: false
server:
  extraFlags:
    - web.enable-remote-write-receiver
  fullnameOverride: prometheus
  retention: 24h
  persistentVolume:
    size: 25Gi
helm repo add prometheus-community https://prometheus-community.github.io/helm-charts
helm repo update
helm upgrade --install prometheus prometheus-community/prometheus --namespace observability --create-namespace --version v25.18.0 -f prometheus-values.yaml
Grafana Tempo
Use the following values file for the installation.
tempo-values.yaml
tempo:
  retention: 24h
  persistence:
    enabled: true
    size: 50Gi
  metricsGenerator:
    enabled: true
    remoteWriteUrl: "http://prometheus:80/api/v1/write"
helm repo add grafana https://grafana.github.io/helm-charts
helm repo update
helm upgrade --install tempo grafana/tempo --namespace observability --create-namespace --version v1.7.2 -f tempo-values.yaml
OpenTelemetry Collector
Use the following values file for the installation.
otel-values.yaml
nameOverride: "collector"
mode: deployment
presets:
  kubernetesAttributes:
    enabled: true
config:
  receivers:
    otlp:
      protocols:
        grpc:
          endpoint: ${env:MY_POD_IP}:4317
        http:
          endpoint: ${env:MY_POD_IP}:4318
  processors:
    batch: {}
    memory_limiter:
      check_interval: 5s
      limit_percentage: 80
      spike_limit_percentage: 25
  exporters:
    prometheusremotewrite:
      endpoint: http://prometheus:80/api/v1/write
    otlp:
      endpoint: tempo:4317
      tls:
        insecure: true
  service:
    pipelines:
      traces:
        receivers: [otlp]
        processors: []
        exporters: [otlp]
      metrics:
        receivers: [otlp]
        processors: []
        exporters: [prometheusremotewrite]
helm repo add open-telemetry https://open-telemetry.github.io/opentelemetry-helm-charts
helm repo update
helm upgrade --install otel open-telemetry/opentelemetry-collector --namespace observability --create-namespace --version v0.85.0 -f otel-values.yaml
Grafana
Use the following values file for the installation.
grafana-values.yaml
grafana.ini:
  server:
    domain: YOUR_DOMAIN_HERE
    root_url: "%(protocol)s://%(domain)s/grafana"
    serve_from_sub_path: true
admin:
  existingSecret: grafana-admin-secret
ingress:
  enabled: true
  ingressClassName: nginx
  hosts: [YOUR_DOMAIN_HERE]
  path: /grafana
  pathType: ImplementationSpecific
  annotations:
    cert-manager.io/issuer: letsencrypt-prod
  tls:
    - hosts:
        - YOUR_DOMAIN_HERE
      secretName: grafana-frontend-tls
datasources:
  datasources.yaml:
    apiVersion: 1
    datasources:
      - access: proxy
        apiVersion: 1
        basicAuth: false
        editable: true
        isDefault: true
        jsonData:
          serviceMap:
            datasourceUid: prometheus
          tracesToLogsV2:
            customQuery: true
            datasourceUid: loki
            filterBySpanID: false
            filterByTraceID: false
            query: '{app=~"nevis.+"} |= "$${__span.traceId}"'
            spanEndTimeShift: 10s
            spanStartTimeShift: -10s
        name: Tempo
        orgId: 1
        type: tempo
        uid: tempo
        url: http://tempo:3100
        version: 1
      - access: proxy
        apiVersion: 1
        basicAuth: false
        editable: true
        isDefault: false
        name: Loki
        orgId: 1
        type: loki
        uid: loki
        url: http://loki:3100
        version: 1
      - access: proxy
        apiVersion: 1
        basicAuth: false
        editable: true
        isDefault: false
        name: Prometheus
        orgId: 1
        type: prometheus
        uid: prometheus
        url: http://prometheus:80
        version: 1
persistence:
  enabled: true
Replace YOUR_DOMAIN_HERE with your domain, for example nevis.westeurope.cloudapp.azure.com. Do not remove the square brackets around the domain, if present.
Create a kubernetes secret with the admin credentials for Grafana. Replace YOUR_GRAFANA_USERNAME and YOUR_GRAFANA_PASSWORD with your desired username and password.
kubectl create secret generic grafana-admin-secret --from-literal=admin-user=YOUR_GRAFANA_USERNAME --from-literal=admin-password=YOUR_GRAFANA_PASSWORD --namespace observability
Apply the values file and install Grafana.
helm repo add grafana https://grafana.github.io/helm-charts
helm repo update
helm upgrade --install grafana grafana/grafana --namespace observability --create-namespace --version v7.3.7 -f grafana-values.yaml
The added data sources are available under the /explore path.
Adjusting nginx
In case your nginx does not serve the ingress defined above for grafana, you'll need to adjust it using the nevisadmin4 helm chart.
-
Use this command to get the values of the nevisadmin4 helm chart:
helm get values nevisadmin4 -n nevis -o yaml > current-values.yaml -
Open the
current-values.yamlfile and replace thenginxsection with the following:nginx:enabled: truecontroller:service:externalTrafficPolicy: LocaladmissionWebhooks:enabled: falseingressClassResource:name: nginxenabled: trueconfig:annotation-value-word-blocklist: load_module,lua_package,_by_lua,location,root,proxy_pass,serviceaccount -
Update the nevisadmin4 helm chart with the new values
- Add the helm repository.
-
If you are using the rolling release:
helm repo add nevis 'https://dl.cloudsmith.io/basic/nevissecurity/rolling/helm/charts/' \--username USERNAME \--password PASSWORDhelm repo updateGet the
USERNAMEandPASSWORDby selecting a docker image on the Nevis portal -
If you are using LTS24:
helm repo add nevis 'https://dl.cloudsmith.io/basic/nevissecurity/lts-202405/helm/charts/' \--username USERNAME \--password PASSWORDhelm repo updateGet the
USERNAMEandPASSWORDby selecting a docker image on the Nevis portal
-
helm upgrade nevisadmin4 nevis/nevisadmin4 -n RELEASE_NAMESPACE -f current-values.yaml --version RELEASE_VERSIONReplace
RELEASE_NAMESPACEwith the namespace of nevisadmin4. ReplaceRELEASE_VERSIONwith the version of the nevisadmin4 helm chart you are using. If you omit the version, your installation will be updated to the latest version. - Add the helm repository.
Adding dashboards
Follow the instructions on how to import dashboards from the official grafana docs. We recommend importing the following dashboards:
15757(Kubernetes / Views / Global)15758(Kubernetes / Views / Namespaces)15759(Kubernetes / Views / Nodes)15760(Kubernetes / Views / Pods)14900(Nginx)12680(Request Handling Performance)
Endpoints
With the above setup the following endpoints can be used:
otelUrl: http://otel-collector.observability:4318
tracesEndpoint: http://otel-collector.observability:4318/v1/traces
metricsEndpoint: http://otel-collector.observability:4318/v1/metrics
logsEndpoint: http://otel-collector.observability:4318/v1/logs
prometheusUrl: http://prometheus.observability:80