Log event check
Log event check is used to detect malfunction of a component, connectivity issues between components, or unwanted manipulations / potential attacks against the infrastructure. The built-in log event check module of nevisAdmin requires access to the log data using Elasticsearch The nevisAppliance administration image includes the ELK (Elasticserach, Logstash, Kibana) stack out of the box without the requirement of packaging / installing the software manually. A guide how to set up Elasticsearch using the nevisAppliance can be found in the nevisAppliance reference guide. See the chapter Splunk integration, if you are using Splunk instead of Elasticsearch. or Splunk to process log data.
The log event check functionality is enabled by setting the host and port of the Elasticsearch cluster within the ch.nevis.nevisadmin.monitor.loghost.address property (see the chapter: Properties, about configuring nevisAdmin properties).
ch.nevis.nevisadmin.monitor.loghost.address=localhost:9300
ch.nevis.nevisadmin.monitor.loghost.weburl=https://adminsrv.zh.adnovum.ch/nevislog/
The check for new log events is performed every two minutes. The search window is set to 5 minutes Window size id defined by the ch.nevis.nevisadmin.monitor.loghost.window property (in seconds) by default. nevisAdmin searches for event messages with the severity "warning" The severity search string is defined by the ch.nevis.nevisadmin.monitor.loghost.searchpattern property. You may also specify individual severity search patterns for each module using the ch.nevis.nevisadmin.monitor.loghost.<module>.searchpattern property (where <module> represents the module's name, e.g., apache) or higher.
Alerts are sent by SNMP and SMTP, see the chapter: Alerting. The ch.nevis.nevisadmin.monitor.loghost.weburl property defines the URL where you may reach the web front-end (Kibana) and is used within the notification emails if configured.
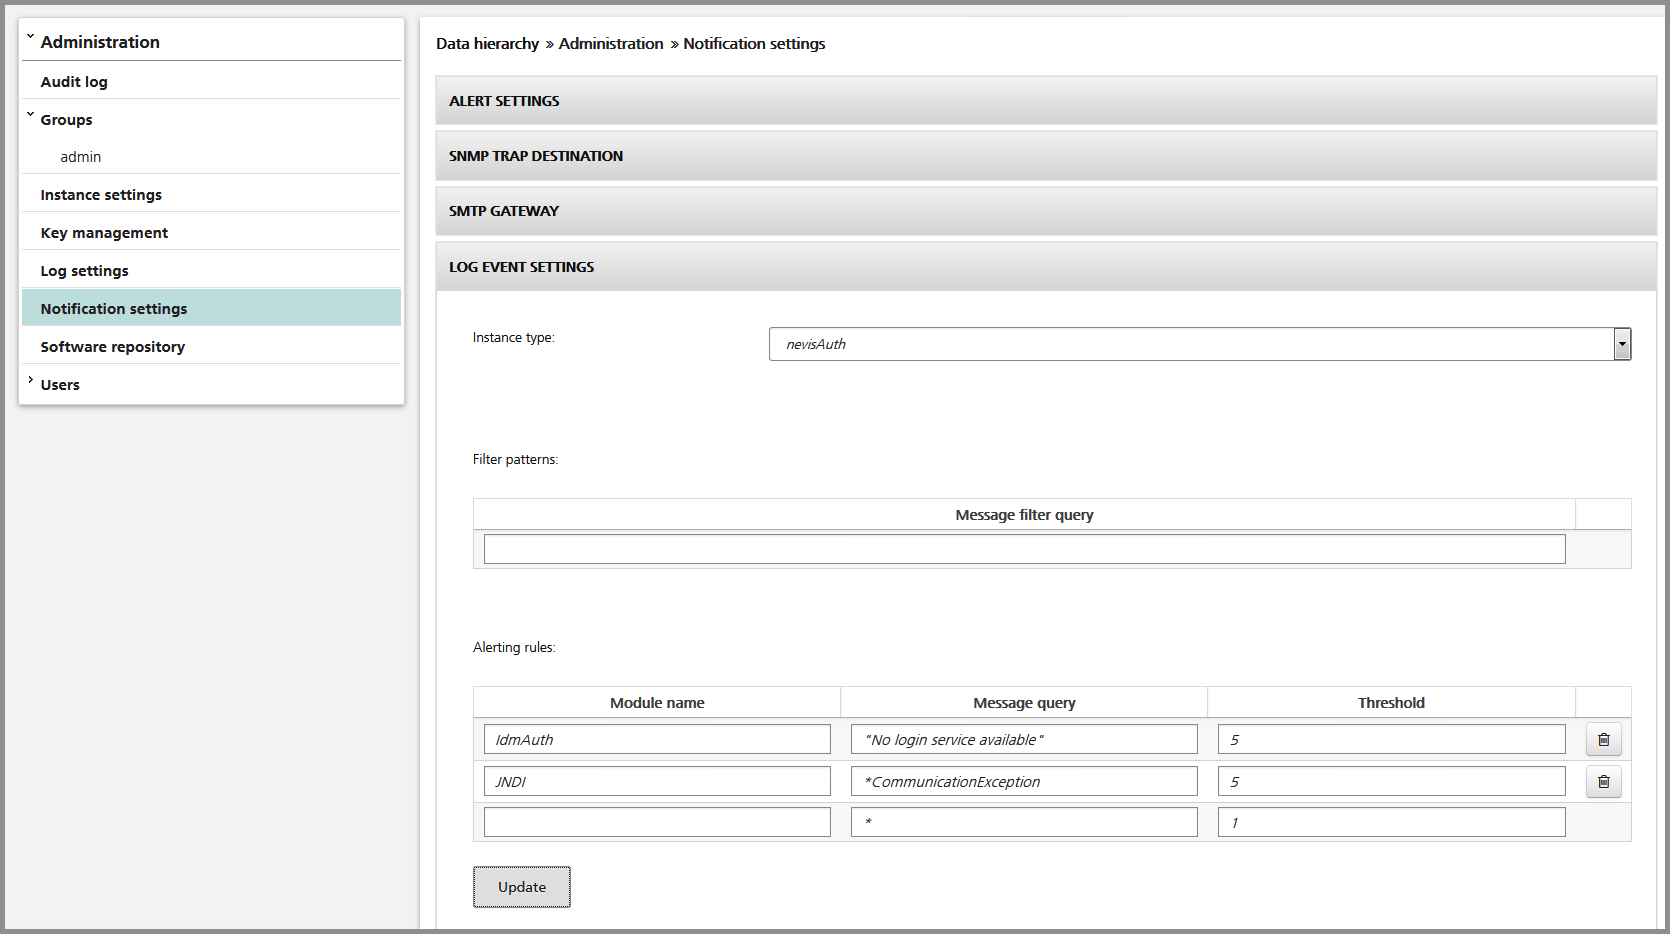
The rules that define which events shall be monitored are configured within the notification settings, see the chapter: Notification settings, and the figure below, respectively. The rule definitions are made on a per component basis.
- Filter patterns: These filters are used to define patterns for log messages which shall be ignored. The patterns use the Apache Lucene query string syntax (or the Splunk command syntax if you have configured nevisAdmin to connect to your Splunk server, see the chapter: Splunk integration).
- Alerting rules: These rules define which log events shall create alerts. The "module name" defines the name (usually a literal string) of the module causing the error (it is equivalent to a trace group for most of the messages). The "message query" defines a pattern to match the message against. The patterns use the Apache Lucene query string syntax (or the Splunk command syntax if you have configured nevisAdmin to connect to your Splunk server, see the chapter: Splunk integration). The "threshold" defines the number of events within the defined period of time (default 5 minutes) which shall cause an alert if this number is reached, e.g., 10 means that an alert is generated if the matching log message occurs 10 or more times within five minutes.
You may either use a positive or negative rule model to describe the messages which shall create an alert:
- Positive: define alert rules by specifying the module names and message patterns (see also the chapter: Rule examples).
- Negative: define alert rules by using wildcards for the module name and the message pattern and specify filter patterns for those messages to ignore.
Both (positive / negative) approaches may be combined, because nevisAdmin always tries to use the best matching rule for each module, allowing you to start with a very generic rule set and improving it by adding new patterns after detecting a new event type. Rules for the same module exclude each other and pay attention not to configure patterns which exclude each other from any match (message query for the same module must not match each other).
The rules are also applied when generating a usage report, see the chapter: Usage reports, showing how many messages matched the defined patterns within the period. The "31 days" report may exceed the time range for which Elasticsearch stores message indexes and the result in the report may not be accurate if indexes expire earlier. of time for which the report has been generated.
The rules are also available as search patterns within the log viewer of nevisAdmin, see the chapter Searching notification events.
Rule examples
The following tables list some rules which might be used to monitor different kind of events:
nevisProxy, instance resource shortage or server errors:
| Module name | Message query | Threshold | Description |
|---|---|---|---|
| NavajoRequ | "worker has been crashed" | 1 | Unexpected process termination. A new process will automatically be started, but this event must be analyzed by the Support team. |
| NavajoSess | "max.session overflow" | 1 | Local session cache has no free entries. New users can’t log in any longer. The session store needs to be freed / its size increased. |
| NavajoMysq | * | 10 | Errors while communicating with the MySQL remote cache. The database status must be checked or the tables need to be recreated. |
| apache | "server reached MaxClients setting" | 1 | Server has no idle threads. Users are waiting to be served by the proxy. |
| apache | [emerg] OR [alert] | 1 | Any Apache specific events with severity "emergency" (system is unusable) or "alert" (action must be taken immediately). |
| apache | [crit] | 2 | Any repeated Apache specific events with severity "critical" (critical condition). |
| mod_qos | [crit] OR [alert] OR [emerg] | 1 | Any severe message generated by mod_qos. |
nevisProxy, configuration errors:
| Module name | Message query | Threshold | Description |
|---|---|---|---|
| NavajoStar | "failed during initialization of servlet" | 1 | Connector servlet could be initialized and won’t be available to server requests. |
| NavajoStar | "OutOfMemoryError" | 1 | nevisProxy could not start due to a memory allocation error (not enough memory granted). |
| NavajoRequ | "could not be invoked" | 1 | Connector servlet could not be used due to an initialization error. |
| NavajoRequ | *invokeChain | 1 | A filter could not be used due to an initialization error. |
nevisProxy, communication errors:
| Module name | Message query | Threshold | Description |
|---|---|---|---|
| IW4HttpCon | * | 5 | Any error while communicating with an application server. |
| IW4HttpsCo | * | 5 | Any error while communicating with an application server. |
| IW4Esau4Co | * | 5 | Any communication error to nevisAuth. |
nevisProxy, validation errors (WAF):
| Module name | Message query | Threshold | Description |
|---|---|---|---|
| IW4ValidFl | * | 10 | Request blocked by an InputValidationFilter (any request parameter). |
| IW4JsonFlt | * | 10 | Request blocked by a JSON filter. |
| IW4XMLVali | * | 10 | Request blocked by an XML filter. |
| IW4SoapFlt | * | 10 | Request blocked by a SOAP filter. |
| IW4ICAPFlt | * | 10 | Request blocked by an ICAP filter. |
| IW4Encrypt | * | 10 | Request blocked by an encryption / signing filter. |
| IW4UrlEncr | * | 10 | Request blocked by an encryption / signing filter. |
| IW4CSRFFlt | * | 10 | Request blocked by the cross-site request forgery filter. |
| IW4ParamFl | * | 10 | Request blocked by a parameter filter (any request parameter). |
Splunk integration
Telling nevisAdmin to connect to your Splunk server is done by configuration of the appropriate settings within the nevisadmin.properties file. The [table] below shows the necessary properties.
# host to connect to:
ch.nevis.nevisadmin.monitor.loghost.address=splmaster01.zh.adnovum.ch:8089
# type of the loghost must be set to "splunk"

ch.nevis.nevisadmin.monitor.loghost.type=splunk
# credential (username and password) to connect to your Splunk server:
ch.nevis.nevisadmin.monitor.loghost.user=admin
ch.nevis.nevisadmin.monitor.loghost.password=password
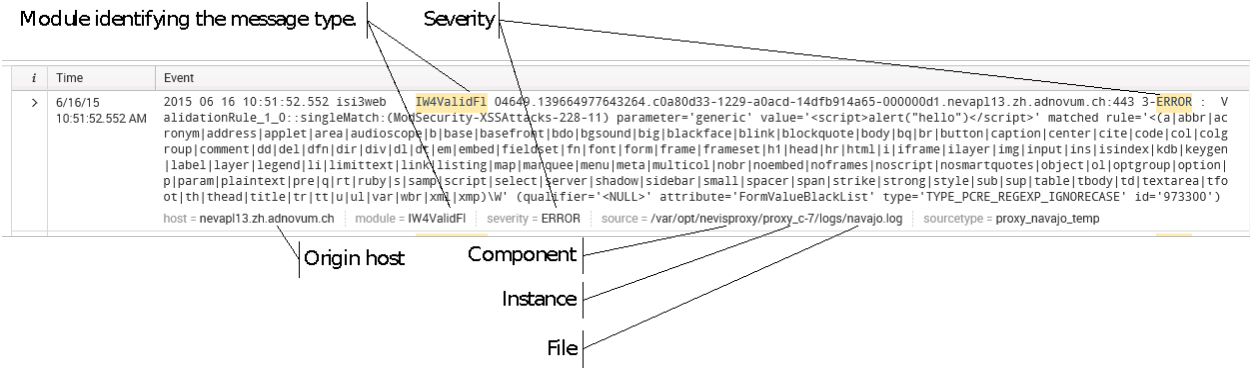
nevisAdmin requires the following fields to search your Splunk server for errors:
host: A standard field used by Splunk to identify the original host where the log message has been generated.source: A standard field used by Splunk to identify the log facility where the log message has been written to. This path must contain the component name, the instance name as well as the file name (<component>/<instance>/log(s)/<file>).severity: This is a custom field which must be defined within your Splunk configuration to identify the severity string within the log message.module: This is a custom field which must be defined within your Splunk configuration to identify the name of the component's module causing an event, e.g., "IW4ValidFl", "IW4HttpCon", or "audit_authenticate".- A valid timestamp defining when the message has been written.