Monitoring Patterns
Introduction
nevisAdmin 4 provides patterns to monitor your infrastructure. These patterns allow you to configure the open source Elastic Stack, to enable the transfer of the component status and of logs via Elastic Beats. Filebeat, Journalbeat and Heartbeat are monitoring agents. They run on the same hosts where Nevis components run and transfer monitoring events to Elasticsearch (via Logstash).
Supported components: nevisProxy, nevisAuth, nevisIDM, nevisMeta, nevisLogRend. Not supported**: nevisFIDO and nevisDetect. Deploym**ent mode: Classic. This means that Kubernetes is currently not supported.
The Elastic Stack features the Kibana GUI, which allows the user to display, filter and search all collected log events at once. It also shows the live status of all components on the dashboard.
The Monitoring patterns configure and deploy Elastic Stack (Elasticsearch, Logstash and Kibana) and Elastic Beats with minimal effort. Data is transmitted via secure connections between the hosts.
Security warning
If you run the free OSS edition of Elastic Stack, then the connection between Kibana and Elasticsearch is neither secure, nor authenticated. To prevent unauthorized access, you have to create firewall rules. See the section Manual Security Configuration further below.
As an alternative, we recommend the Basic edition of Elastic Stack, which has security built-in. See also `http://www.elastic.co/subscriptions.
Prerequisites
Install the following software on the hosts first. nevisAdmin 4 will then configure and deploy the software components using the patterns in the next section.
| Host | Component | Supported Version | Comment |
|---|---|---|---|
| Monitoring host | OpenJDK | 8 | |
| Elasticsearch | 7.6.x | Install OSS via RPM Install commercial via RPM | |
| Logstash | 7.6.x | Install OSS via RPM Install commercial via RPM | |
| Kibana | 7.6.x | Install OSS via RPM Install commercial via RPM | |
| Monitored host | OpenJDK | 8 | |
| Filebeat | 7.6.x | Install OSS via RPM (preinstalled on nevisAppliance)Install commercial via RPM | |
| Heartbeat | 7.6.x | Install OSS via RPM (preinstalled on nevisAppliance)Install commercial via RPM | |
| Journalbeat | 7.6.x | Install OSS via RPM (preinstalled on nevisAppliance)Install commercial via RPM |
When targeting nevisAppliance, Filebeat, Heartbeat and Journalbeat are preinstalled. However, there is currently no dedicated nevisAppliance with Elastic Stack (Elasticsearch, Logstash and Kibana). This means that install these components on a separate, non-nevisAppliance host running RHEL 7.
Upgrading Elastic Stack
For upgrades, see the official documentation from Elastic. Here are some hints:
- First upgrade Elastic Stack (RPMs), then deploy with the patterns of this release.
- If you run your Nevis components (nevisProxy, etc.) on nevisAppliance: Filebeat, Heartbeat and Journalbeat are upgraded automatically if you upgrade nevisAppliance.
Patterns
nevisAdmin 4 provides the following patterns for configuring the Elastic Stack integration:
If you used the monitoring patterns before release 4.7, see the section Migrating from Deprecated Monitoring Patterns further below.
Elasticsearch Instance
The Elasticsearch Instance pattern allows you to set up and deploy Elasticsearch. Elasticsearch is a NoSQL database, which stores the collected log events as documents and provides powerful searching capabilities.
The Elasticsearch Instance pattern deploys Elasticsearch on a single target host; clustering is not supported. For other deployment options, see the section Elasticsearch Connector below. ### Configuration
- The pattern installs a cleanup job on the target host. This job deletes all collected data older than 90 days (logs, syslog and status events). You can change this default by setting the pattern property Log Retention to a different value .
- Regarding the Secure Elasticsearch property: With the "enabled" setting, Elasticsearch is protected by HTTPS and authentication and can be reached directly from external hosts. This means that you can deploy Logstash and Kibana on any host. In this case, you have to deploy Logstash and Kibana on the exact same host where Elasticsearch is deployed. Otherwise they cannot connect to Elasticsearch.
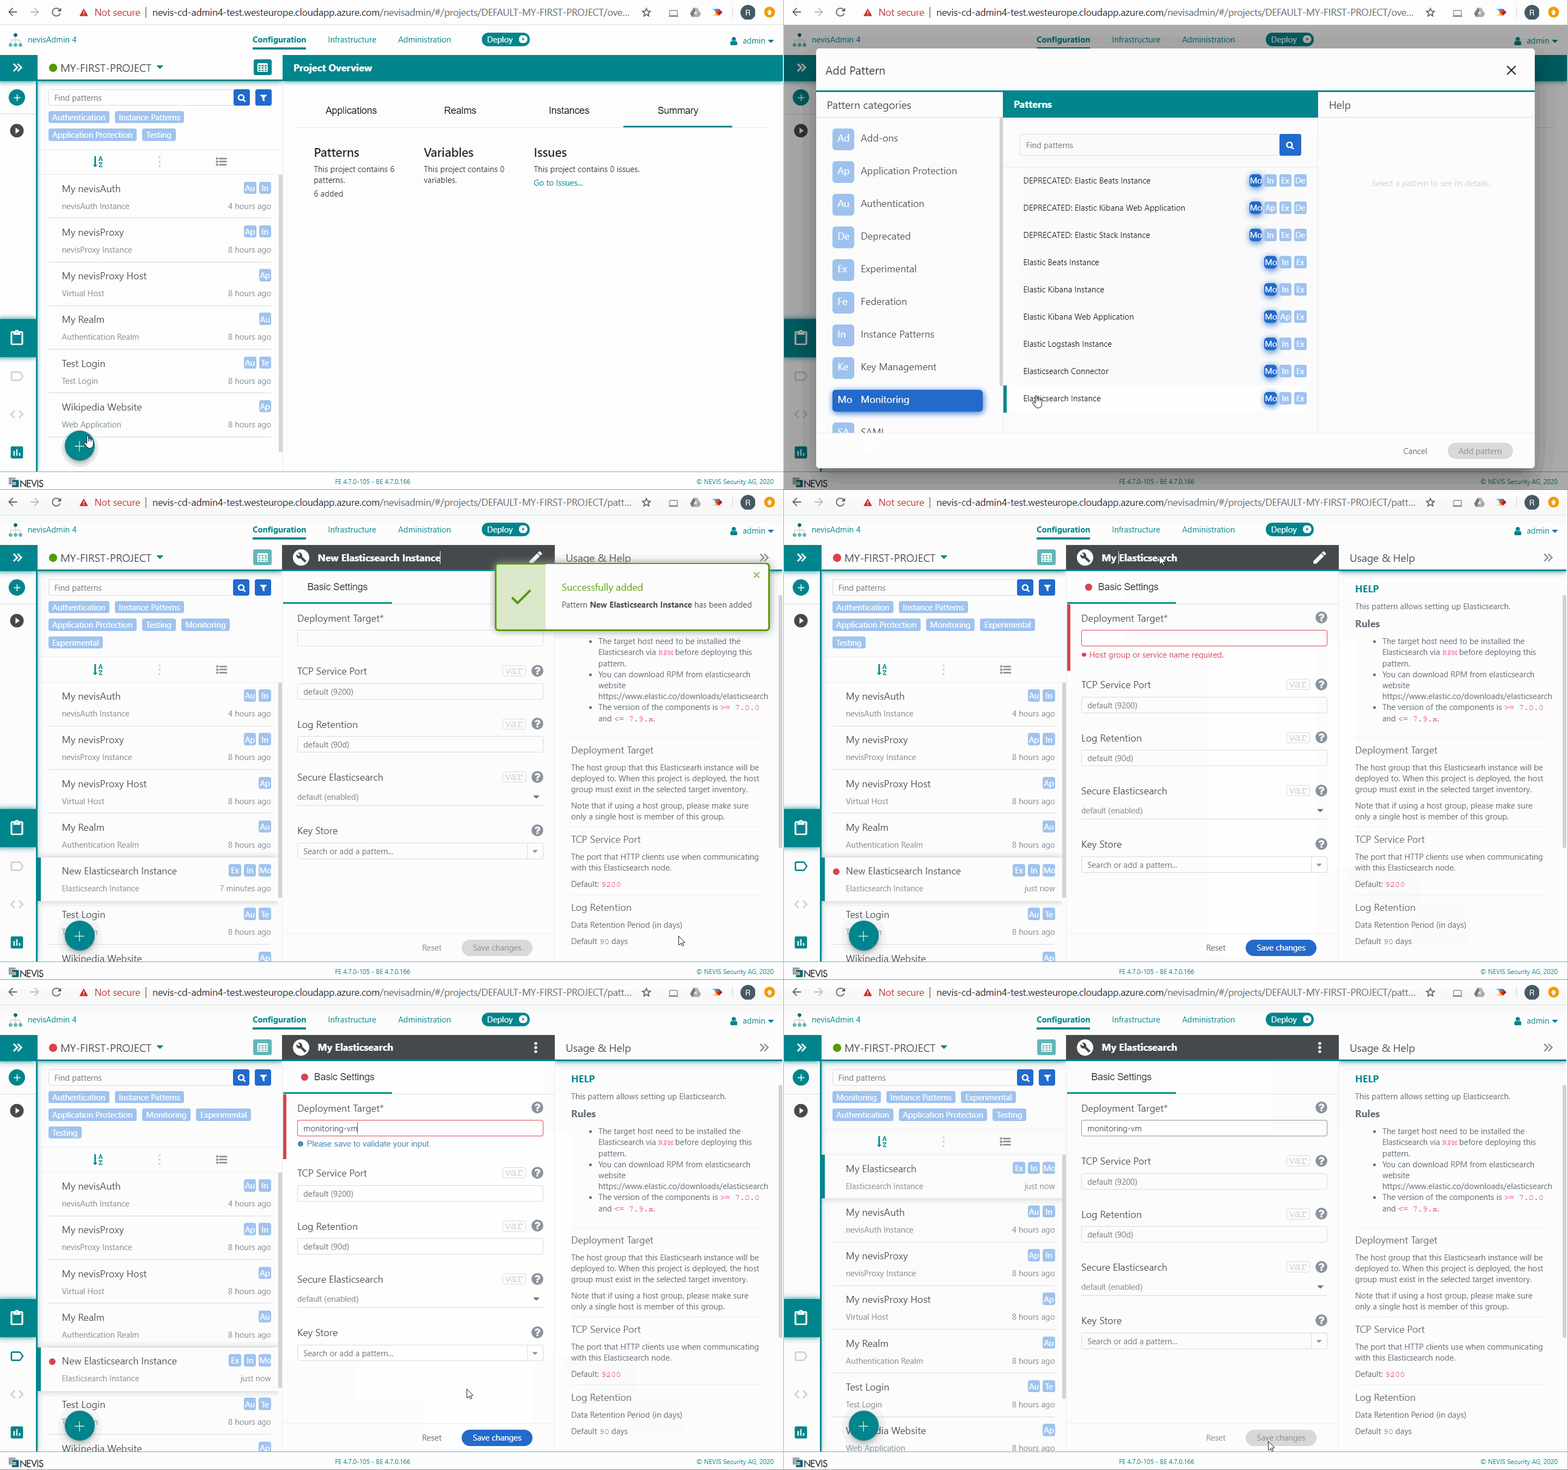
Example Movies
The following example movies assume that you have an inventory with the following target host groups defined:
- monitoring-vm: One host where Elasticsearch, Logstash and Kibana will be running.
- all-nevis-vms: A group containing all the hosts with running Nevis components. The various Beats also run on these hosts.
Elasticsearch Connector
The Elasticsearch Connectorpattern allows you to send Nevis logs to an external Elasticsearch installation that is not managed by nevisAdmin 4.
Use this pattern, instead of the Elasticsearch Instance pattern, in these situations:
- You already have an Elasticsearch installation, possibly including Kibana, and you want to use that one.
- You want to deploy Elasticsearch yourself, for example on multiple hosts (clustering), which nevisAdmin 4 does not support.
- You have subscribed to Elasticsearch in the cloud.
If you use this Elasticsearch Connectorpattern, the components Beats and Logstash are still required and must be managed by nevisAdmin 4. See below for configuration instructions. The Kibana-related patterns cannot be used with the Elasticsearch Connector.
Elastic Beats Instance
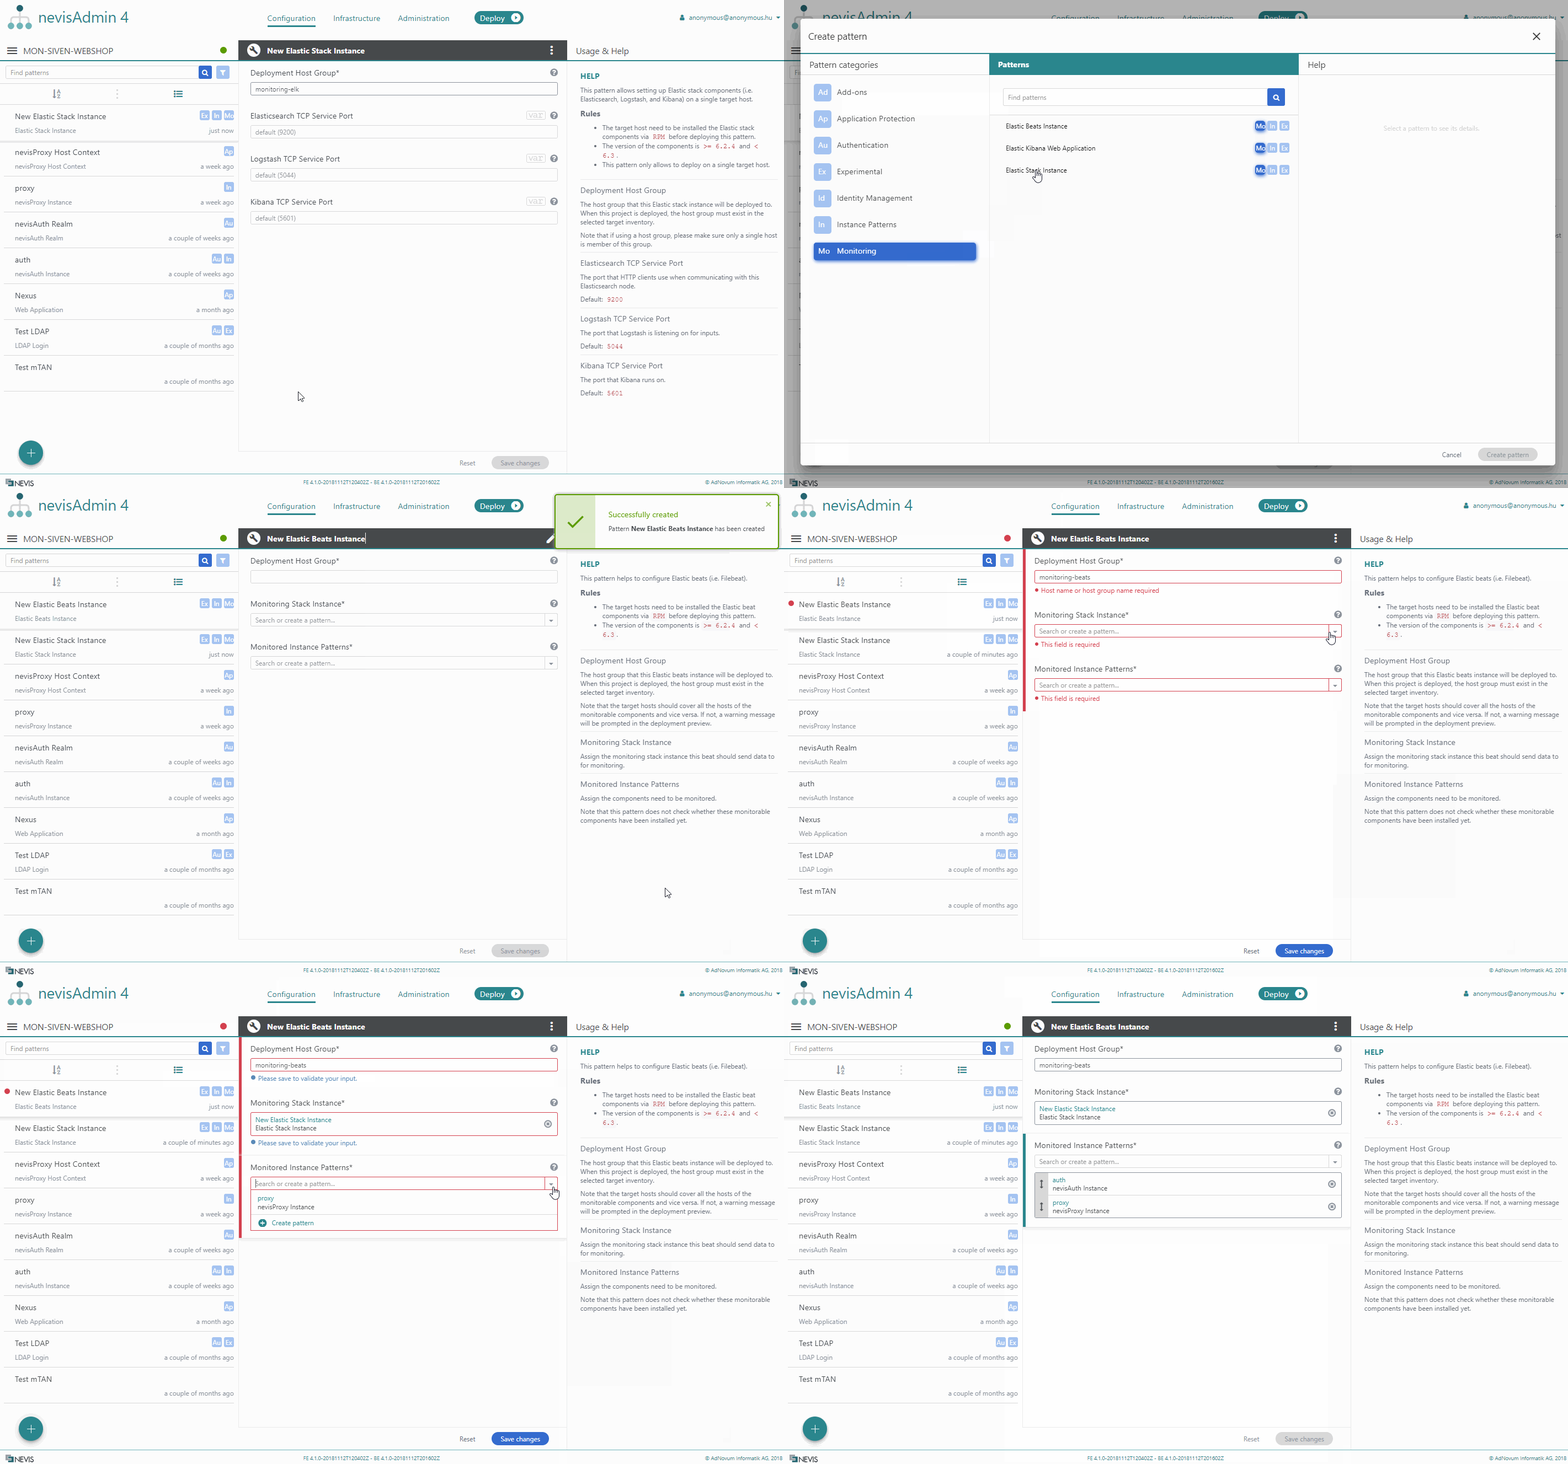
The Elastic Beats Instance pattern sets up Elastic Beats (that is, Filebeat, Journalbeat and Heartbeat) to ship log files, the syslog and the status of monitorable components to Elastic Stack. The various Beats agents connect to Logstash using TLS.
Log Monitoring
The next table lists the log files that are monitored by Filebeat:
| Component | Log type | Log files |
|---|---|---|
| nevisProxy | nevisproxy-navajo | /var/opt/nevisproxy/<instance-name>/logs/navajo.log |
| nevisproxy-access | /var/opt/nevisproxy/<instance-name>/logs/access.log | |
| nevisproxy-events | /var/opt/nevisproxy/<instance-name>/logs/nevisproxy-events.log | |
| nevisproxy-apache | /var/opt/nevisproxy/<instance-name>/logs/apache.log | |
| nevisAuth | nevisauth-audit | /var/opt/nevisauth/<instance-name>/log/audit.log |
| nevisauth-esauth4sv | /var/opt/nevisauth/<instance-name>/log/esauth4sv.log | |
| nevisauth-events | /var/opt/nevisauth/<instance-name>/log/nevisauth-events.log | |
| nevisIDM | nevisidm-application | /var/opt/nevisidm/<instance-name>/log/application.log |
| nevisidm-audit | /var/opt/nevisidm/<instance-name>/log/audit.log | |
| nevisidm-batch | /var/opt/nevisidm/<instance-name>/log/batch.log | |
| nevisidm-events | /var/opt/nevisidm/<instance-name>/log/nevisidm-events.log | |
| nevisMeta | nevismeta.log | /var/opt/nevismeta/<instance-name>/log/nevismeta.log |
Instance Port Monitoring
The Heartbeat process is always running on the same host where the monitored instance is running. The next table lists the ports/host names that are monitored by Heartbeat.
| Component | Description of monitored ports |
|---|---|
| nevisProxy | Ports are gathered from all the virtual hosts. The ports are defined by the Bind Addresses property in the Virtual Host pattern. |
Examples:
| Bind Addresses | Ports |
|---|---|
| http://proxy | 80 |
| http://proxy:1212 | 1212 |
| https://proxy | 443 |
| https://proxy:1234 | 1234 |
| nevisAuthnevisIDMnevisMetanevisLogRend | The monitored port is directly taken from the TCP Service Port property in the corresponding Instance pattern. For the monitored host name, the host name specified in the Instance pattern's deployment target is used (the host name inside the host group). |
Elastic Logstash Instance
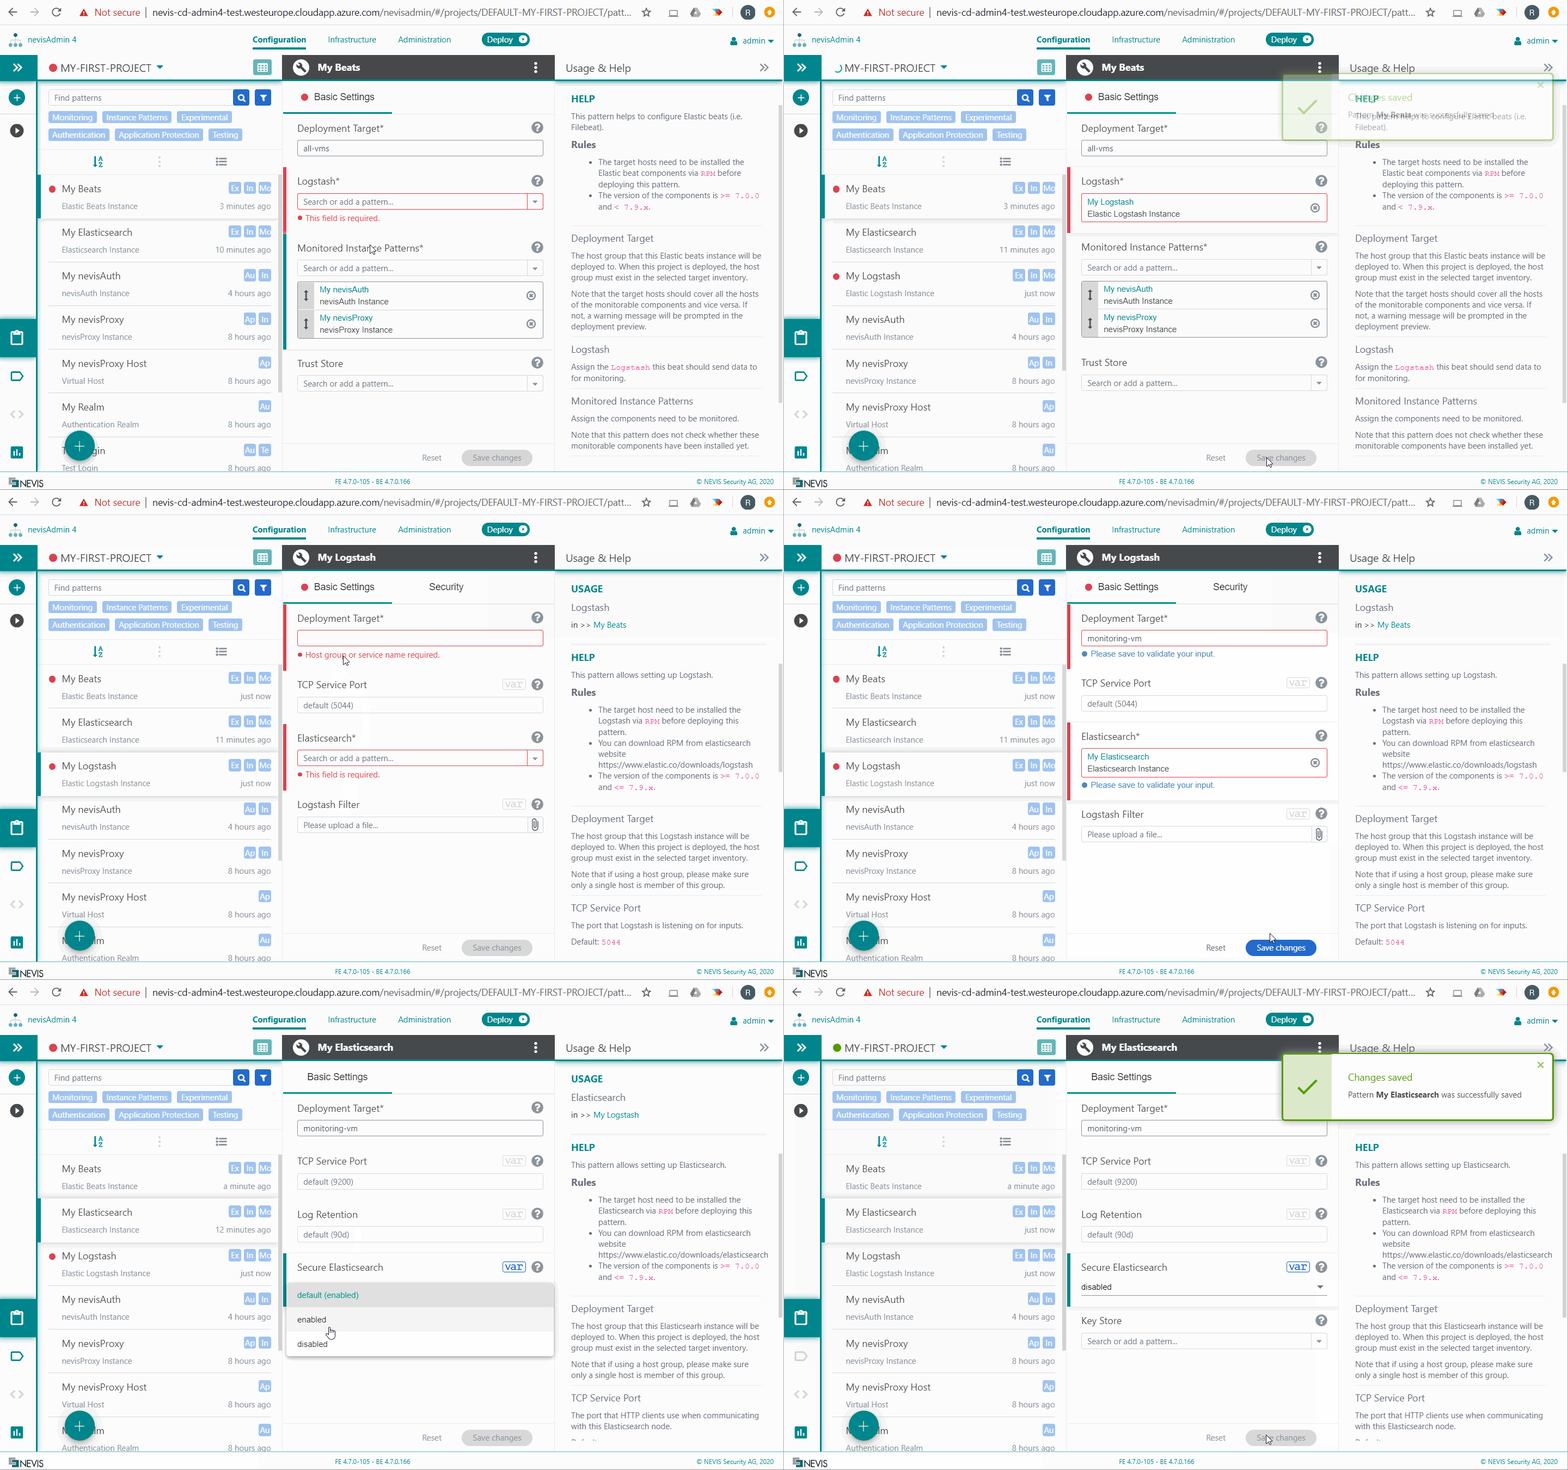
Logstash is a server process that pre-processes log events and inserts them into Elasticsearch. The Logstash configuration deployed by nevisAdmin 4 contains a set of filter scripts. These scripts parse some of the log information into separate fields. This is useful if you later want to query and aggregate the log data, for example with Kibana.
Elastic Kibana Instance
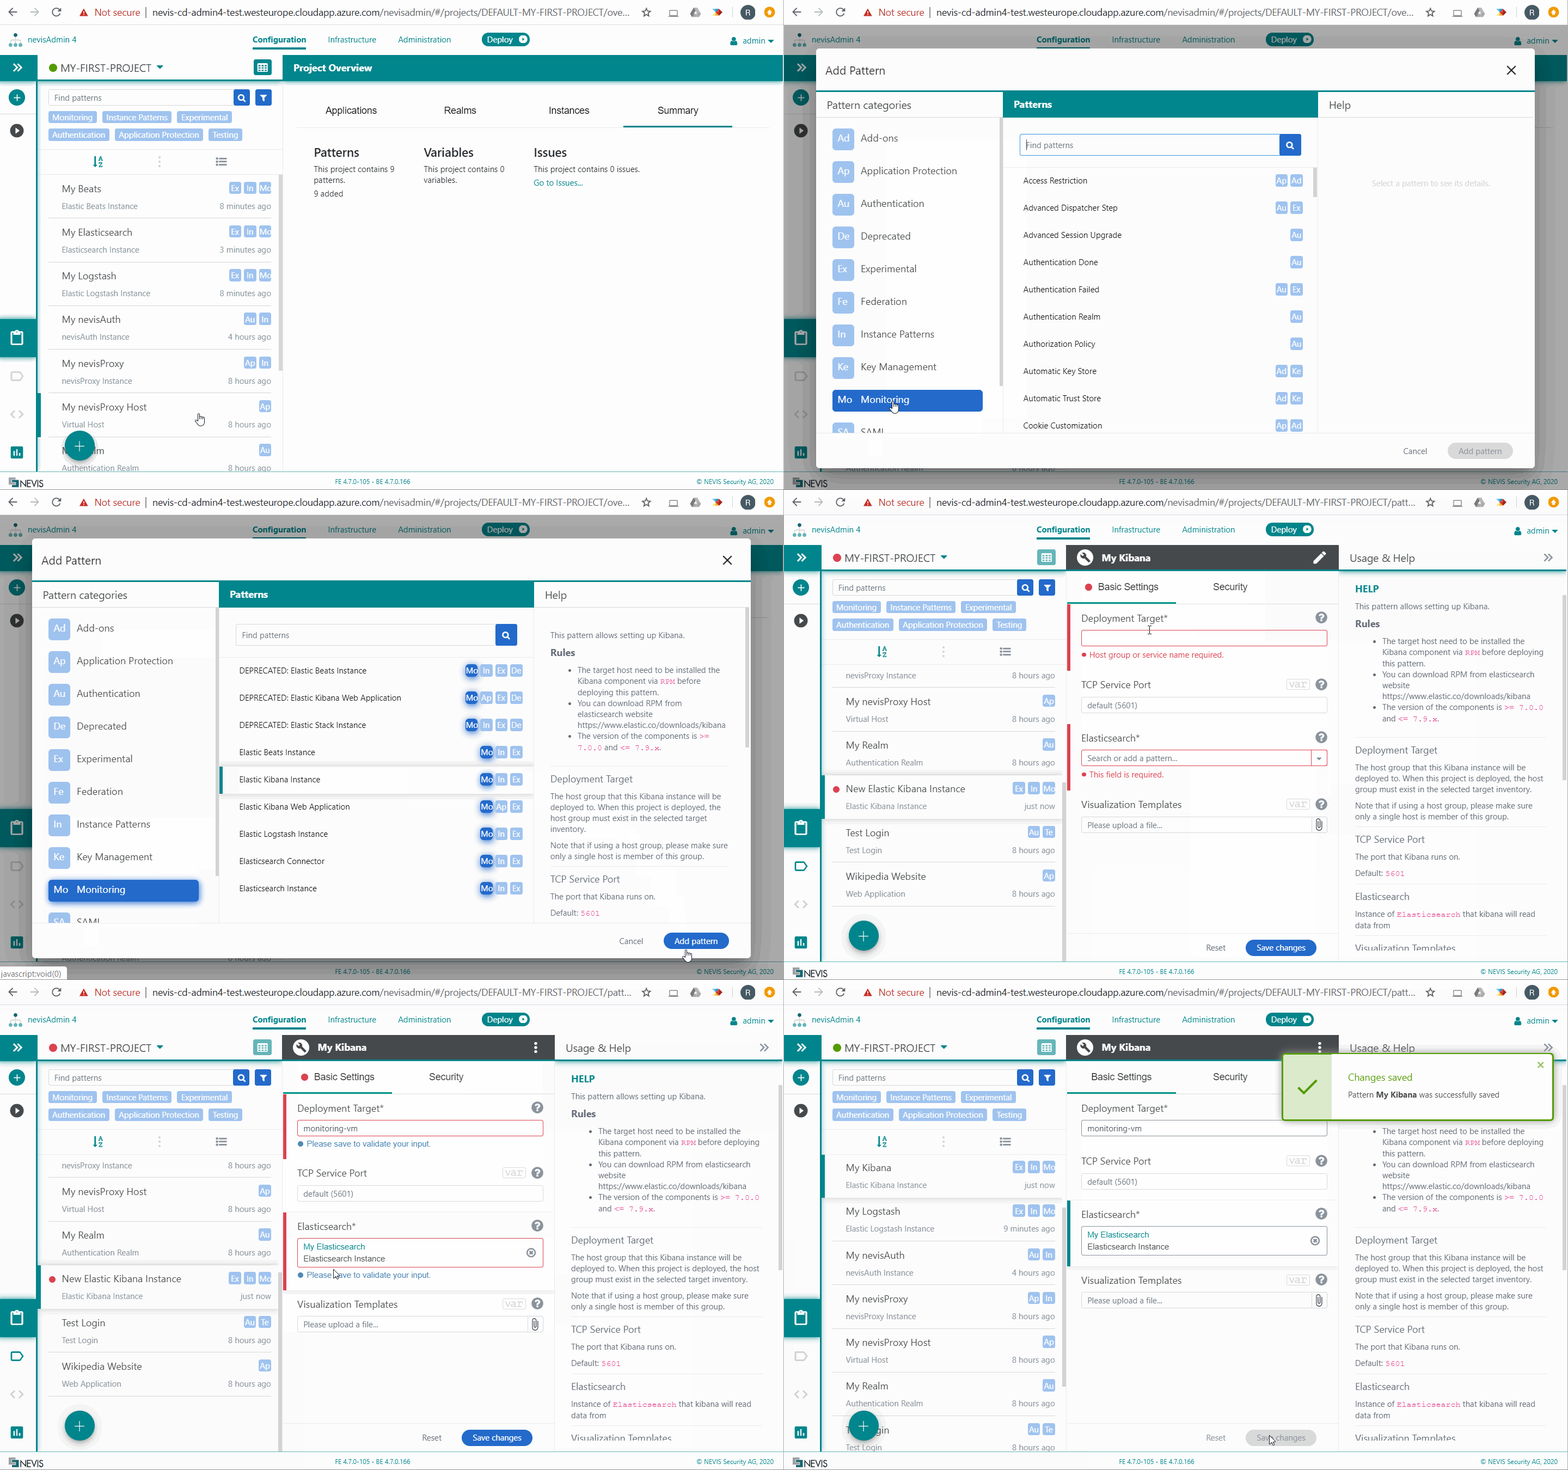
The OSS edition of the Kibana application is not protected by default. Because it gives access to sensitive log data, we recommend the following approach:
- Configure your Elasticsearch Instance (see above) to run on a host inside a well-protected network zone, usually not reachable from the Internet.
- Additionally, set up a nevisProxy Instance on the same host, or on a host with similar protection measures.
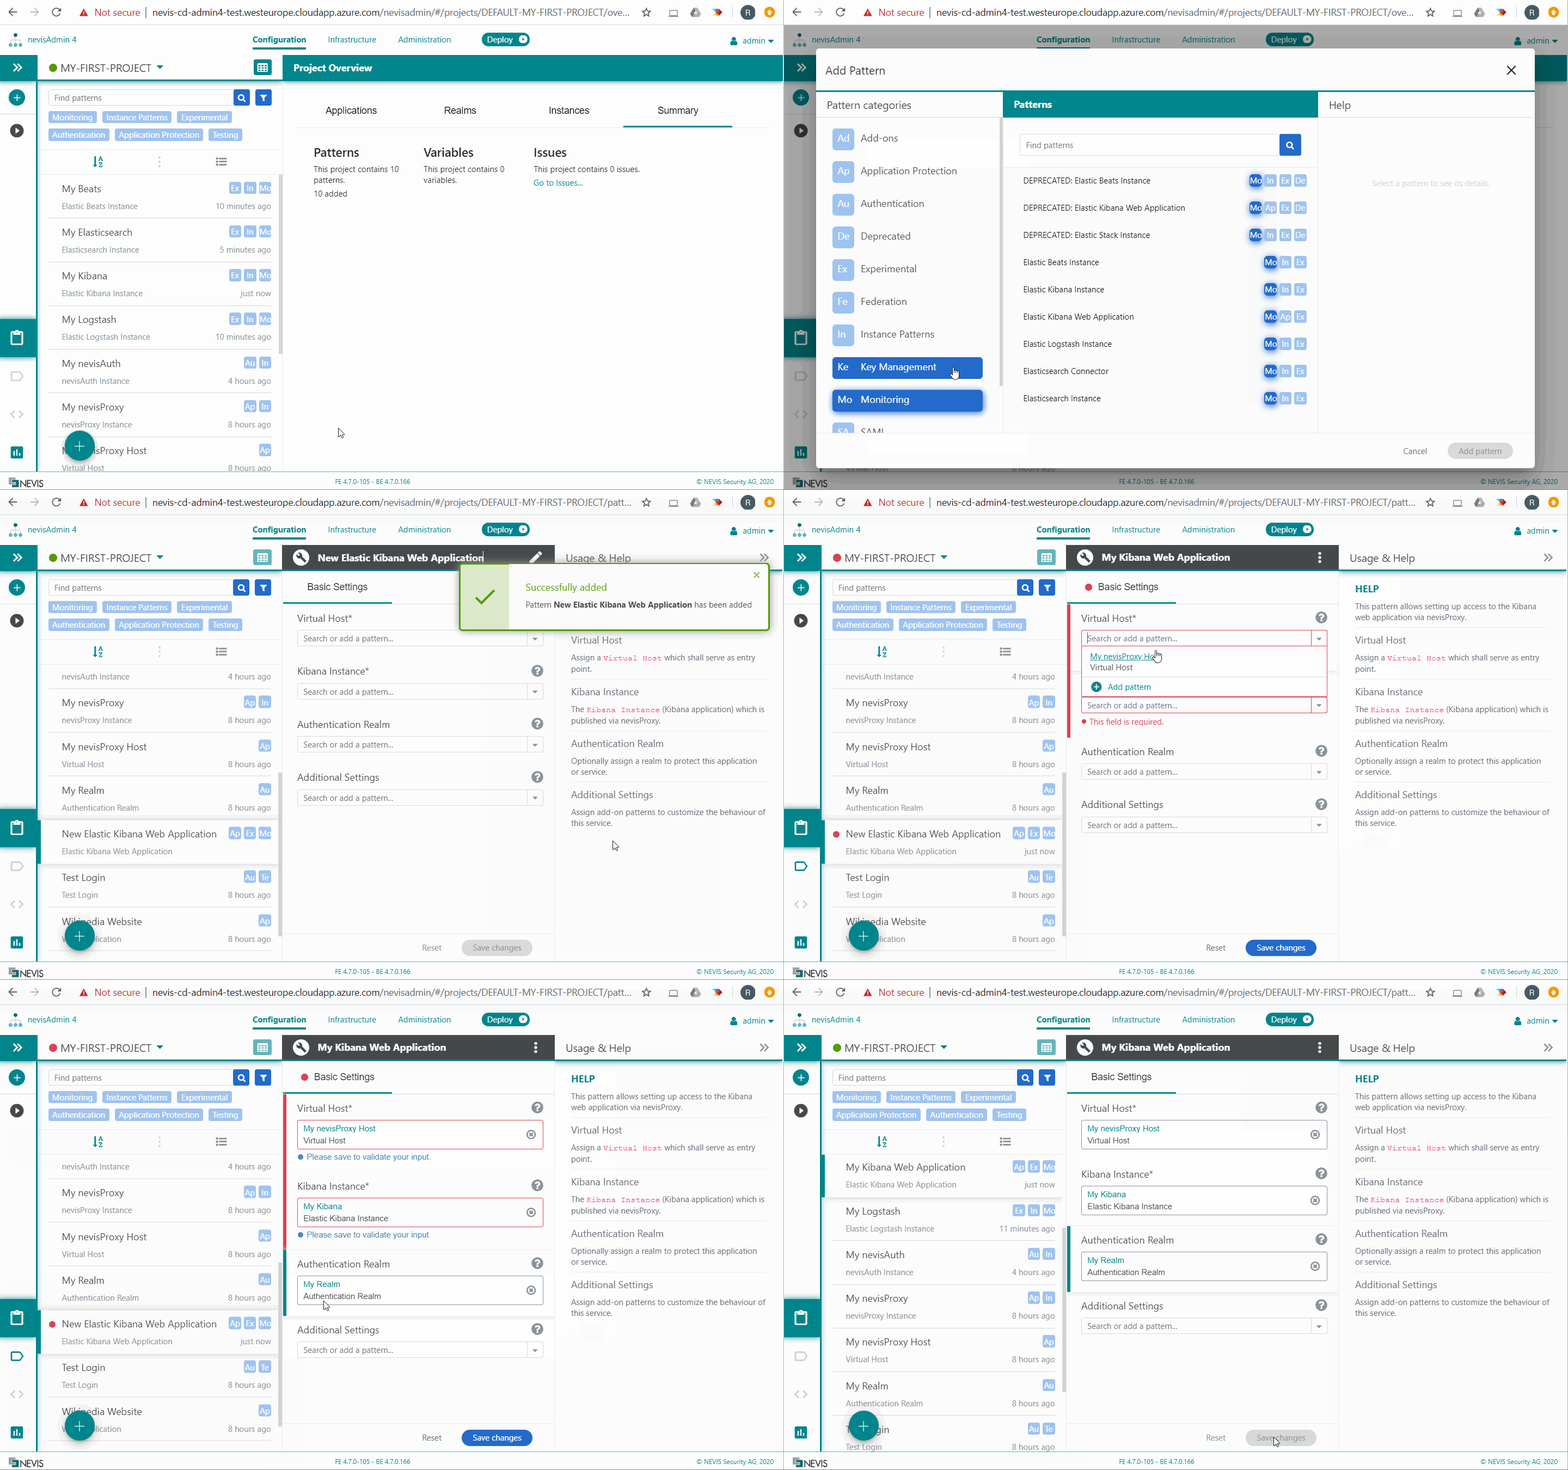
- Add the Elastic Kibana Web Application pattern as documented below.
- Configure an Authentication Realm to restrict access to authenticated users.
- Lock down non-proxied access to Kibana. This must be done on the host where the Kibana instance runs. For more information, see the section Manual Security Configuration below.
The situation is different if you install another edition of Kibana, such as the Basic edition. With these other editions, you need to log in before you can use the Kibana application. This means that the above approach, while possible, is not recommended.
Elastic Kibana Web Application
If you want to access the Kibana web application directly, without protecting it behind nevisProxy, not add an Elastic Kibana Web Application pattern to the Kibana Instance pattern. Direct access to Kibana without nevisProxy is possible this way. This mode is not recommended for the insecure OSS edition, but can be useful if you install another edition such as the Basic subscription.
The Elastic Kibana Web Application pattern configures nevisProxy to make the Kibana web application accessible on the /kibana URL.
In the pattern, optionally configure an Authentication Realm pattern to restrict access to authenticated users, for example nevisIDM users. See also Configuring Authentication Use Cases.
Deploy and test
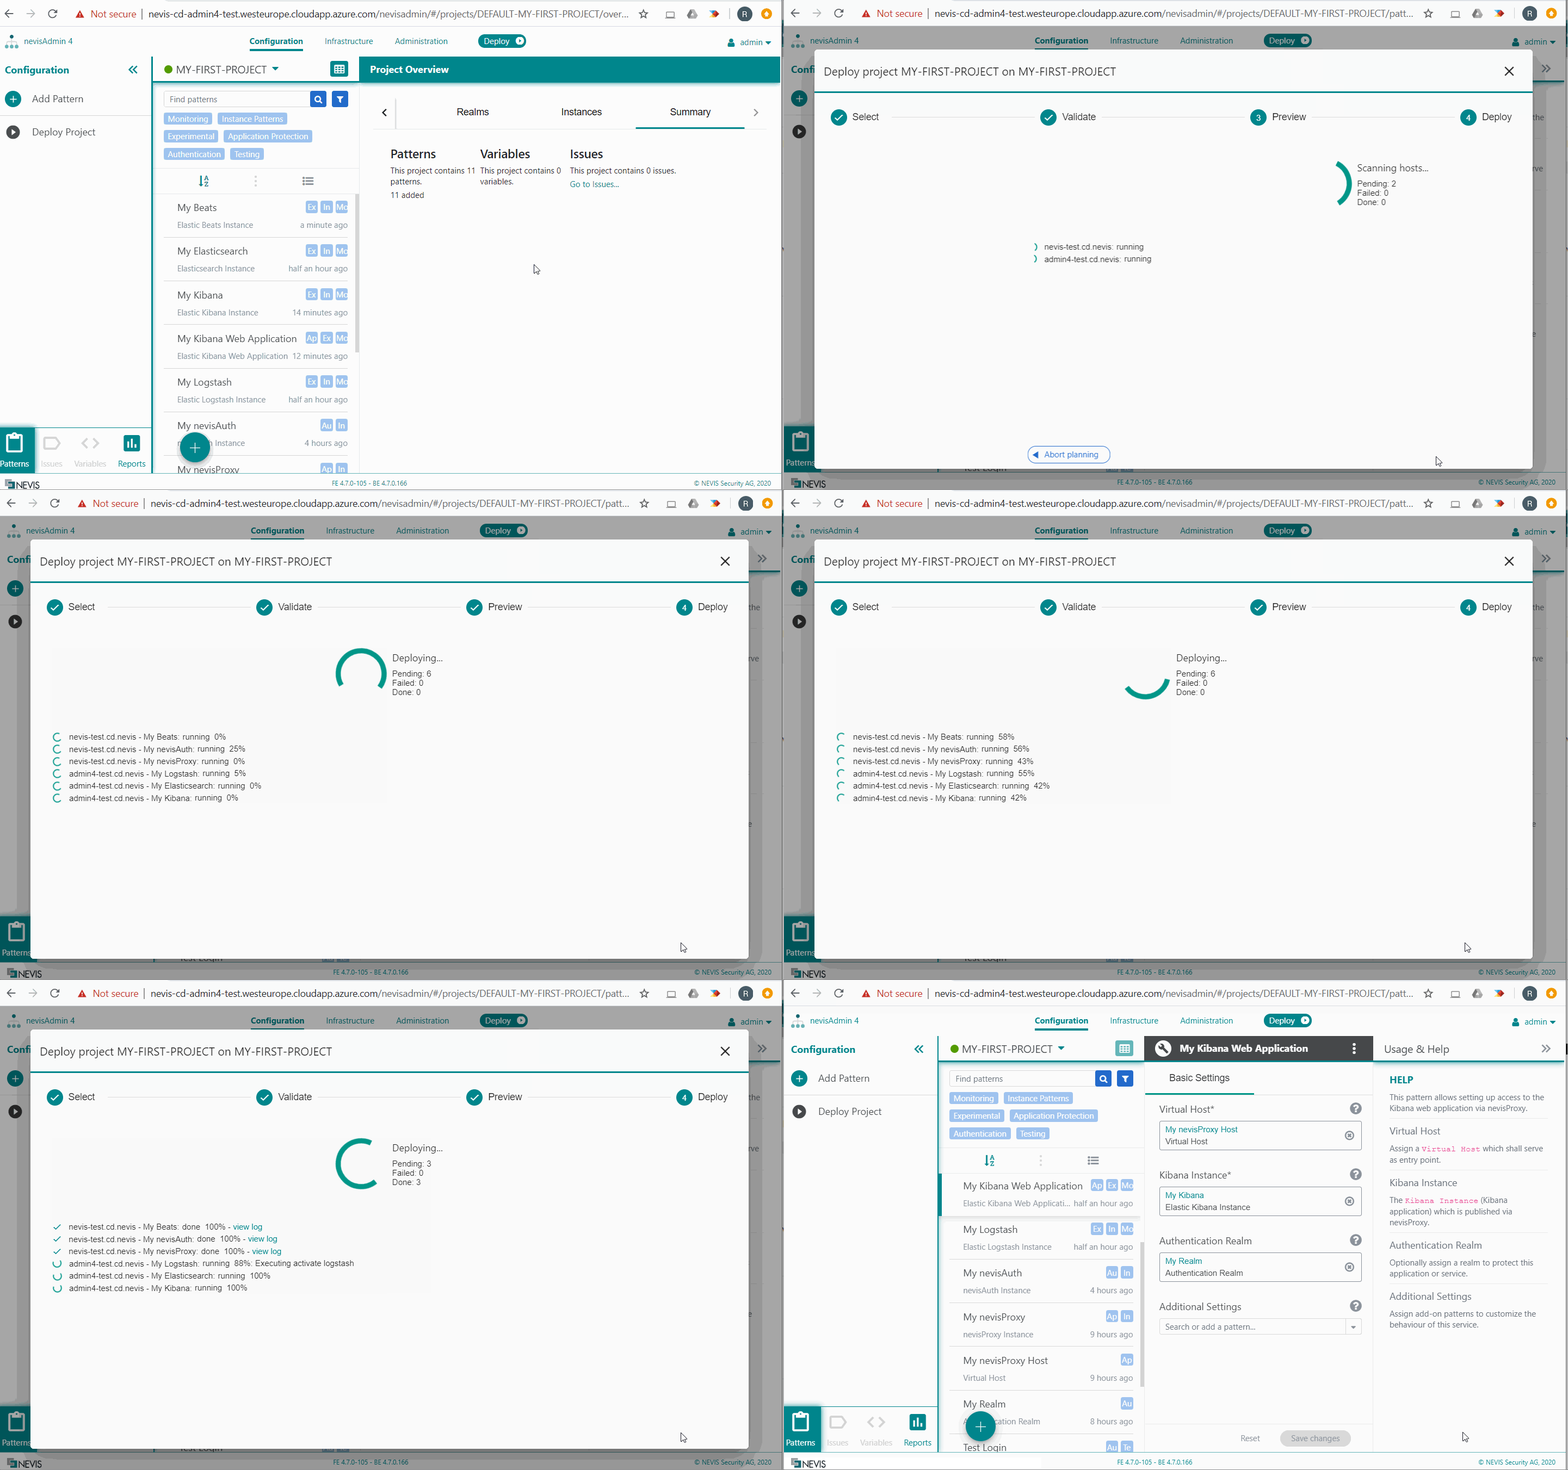
Now that you have created all patterns, you can deploy them. In the movie below, we deploy to an inventory that contains the host groups monitoring-vm and all-nevis-vmsas documented in the section Elasticsearch Instance.
The first time you deploy, it may take a few minutes for Logstash and Kibana to complete their initial configuration.
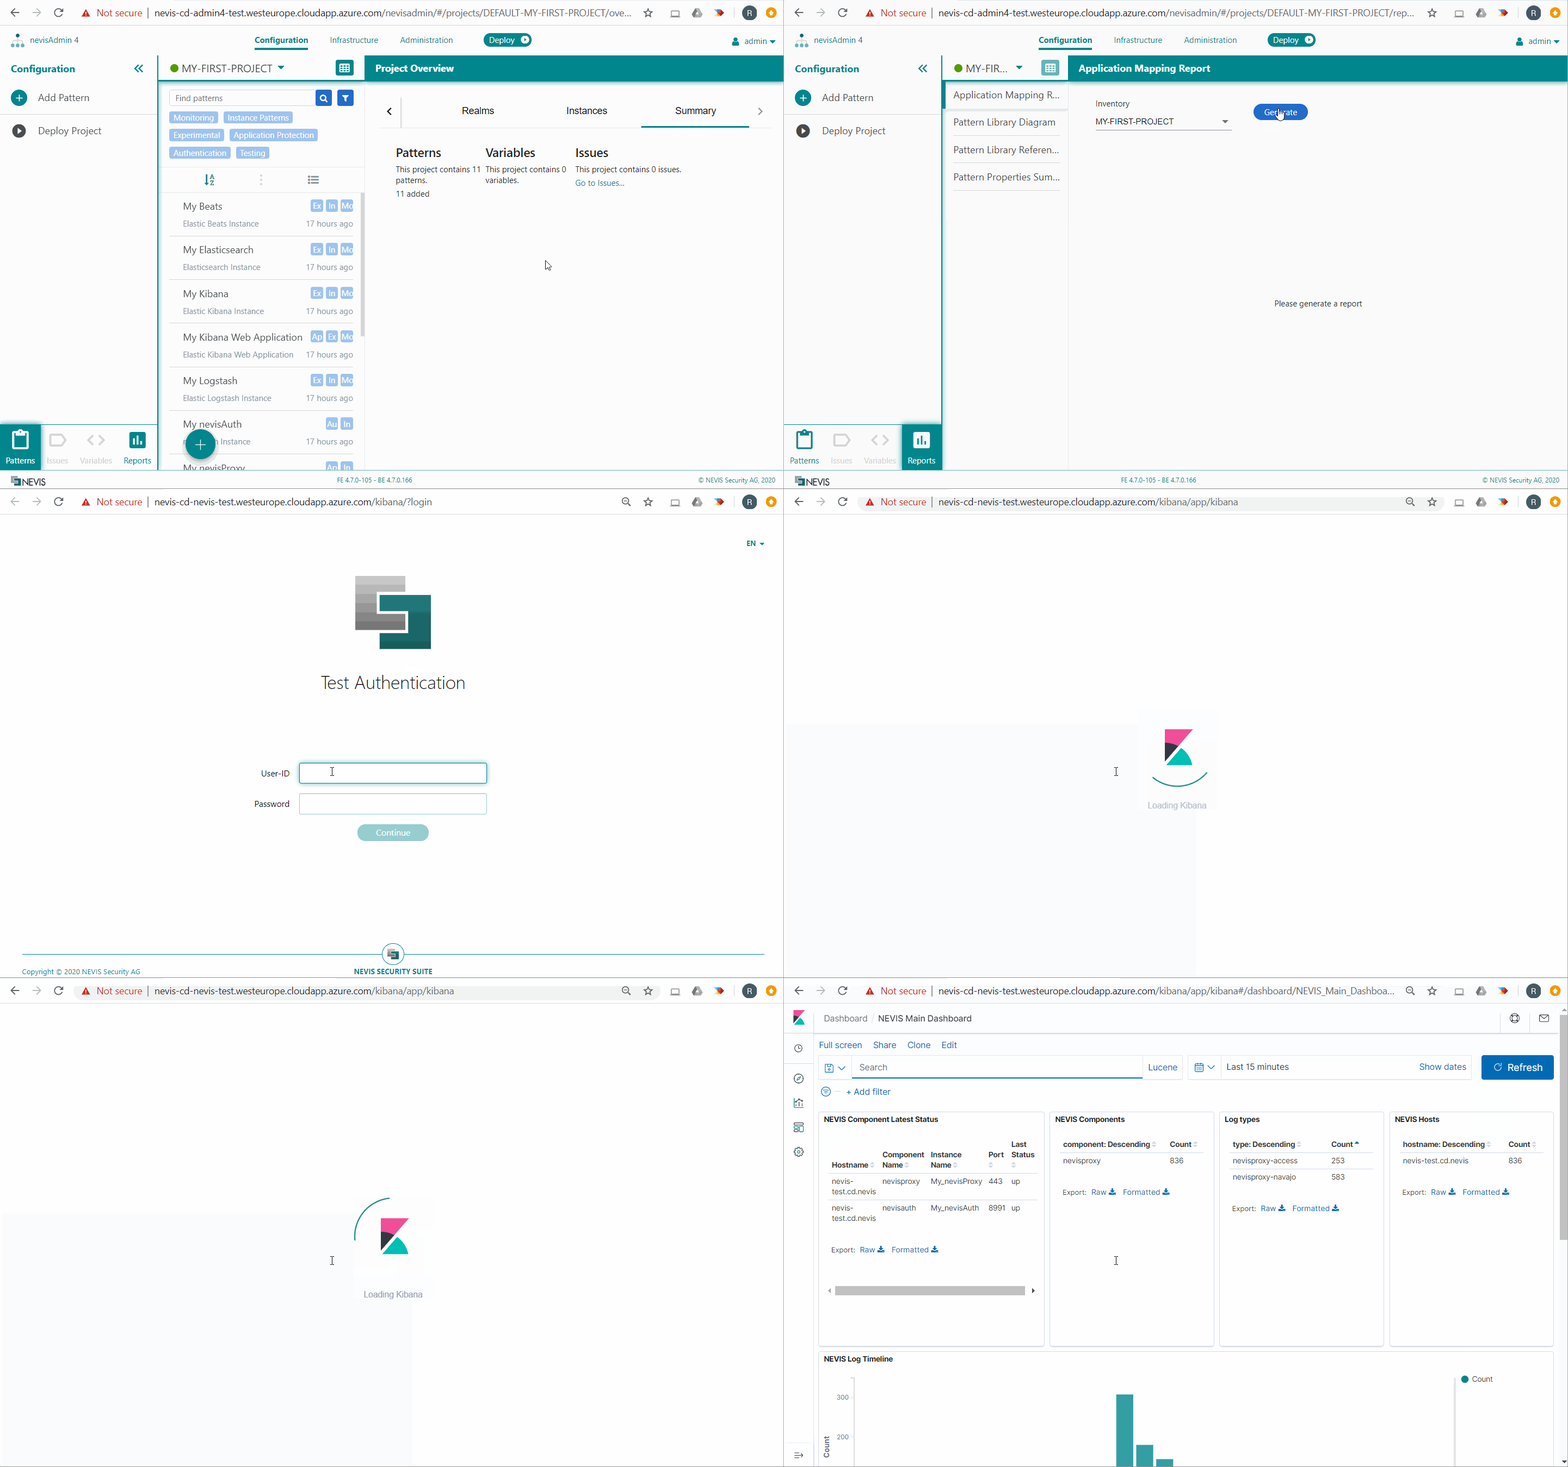
After configuring and deploying Kibana, you can access the Kibana web application via the frontend URL. The exact URL can be found via the Service Mapping Report. The movie below shows it in action:
Manual Security Configuration for OSS
The following applies if you use the insecure OSS edition of the Elastic Stack.
Once the Kibana web application is secured behind nevisProxy, it is critical that you manually restrict direct access to Kibana. This needs to be done by adding firewall rules to the deployment host of the Kibana instance:
Add these firewall rules on Kibana host (RHEL 7):
# Considering Kibana runs on default port 5601 and a.b.c.d being the IP address of nevisProxy Host
iptables -A INPUT -p tcp --dport 5601 -s a.b.c.d -j ACCEPT
iptables -A INPUT -p tcp --dport 5601 -j DROP
iptables-save > /etc/sysconfig/iptables
systemctl enable iptables
systemctl start iptables
With the OSS edition, Elasticsearch does not offer a secure REST endpoint, nor is it authenticated.
- For this reason, nevisAdmin 4 configures Elasticsearch (OSS edition) to bind to localhost. This way, no external access to Elasticsearch is possible.
- The consequence is that Logstash and Kibana, which connect to Elasticsearch, must be installed on the same host.
As an alternative, consider using another edition, such as the Basic subscription, which does not have these limitations.
Migrating from Deprecated Monitoring Patterns
Starting with release 4.7, the Monitoring patterns have changed:
- In release 4.6 and earlier, the Elastic Stack Instance pattern included Elasticsearch, Logstash and Kibana.
- From release 4.7 onward, there are separate instance patterns for Elasticsearch, Logstash and Kibana, which provides additional deployment flexibility.
To migrate from 4.5 or 4.6, follow these steps:
- Create new patterns for all the components as documented below.
- The deployment target (host) for the new Elasticsearch Instance, Elastic Logstash Instance and Elastic Kibana Instance patterns is the same as the target you used in the old Elastic Stack pattern.
- Delete the old deprecated patterns.
- Deploy
You may get the following error during first deployment after migrating: Ports required by logstash/kibana/elasticsearch instance (...) are occupied by another process.
If you get this error, stop the corresponding processes first and then try deploying again:
systemctl stop logstash
systemctl stop kibana
systemctl stop elasticsearch
See Also