Monitoring Patterns
Introduction
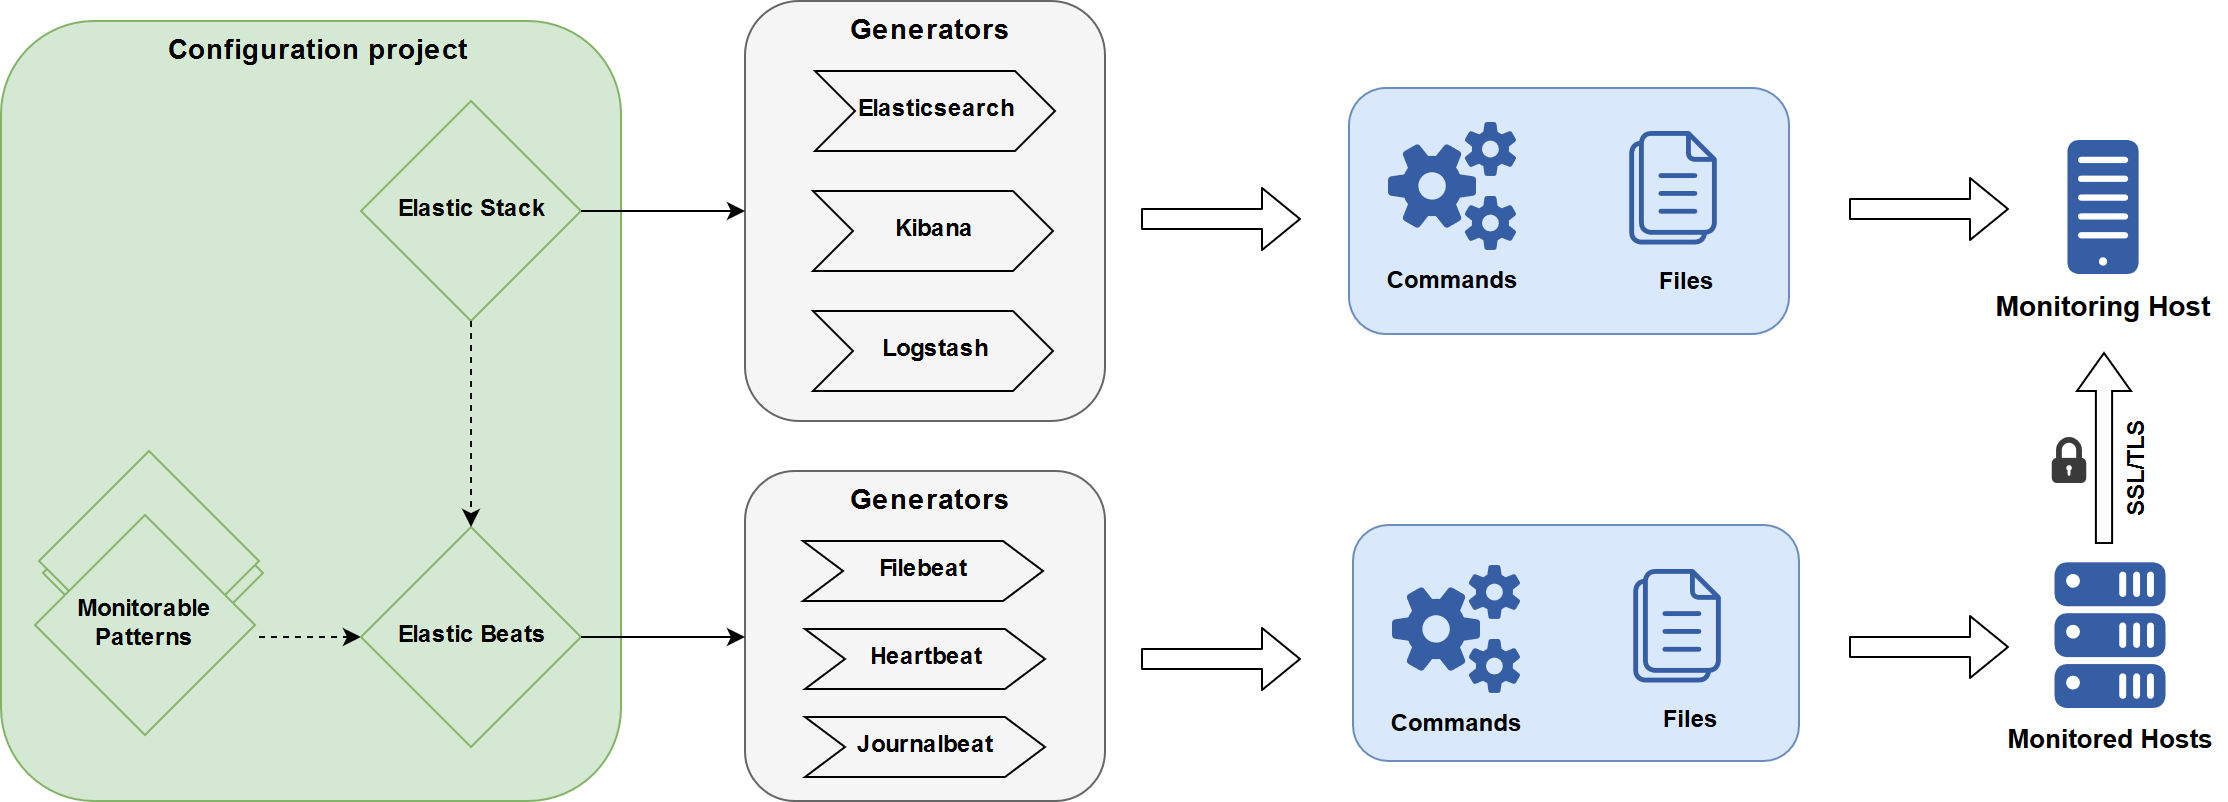
nevisAdmin 4 provides patterns to monitor your infrastructure. These patterns allow you to configure the open source Elastic Stack, to enable the transfer of logs (both file and syslog) and of the component status via Elastic Beats. The Elastic Stack features the Kibana GUI, which allows the user to display, filter and search all log files collected at once. It also shows the live status of all components on the dashboard.
The Monitoring patterns configure and deploy Elastic Stack (Elasticsearch, Logstash and Kibana) and Elastic Beats with minimal effort. Data is transmitted via secure connections between the hosts. However, there are a couple of mandatory security configurations that needs to be done manually.
Overview
The next figure gives an overview on the Monitoring patterns:
Prerequisites
The following software should be pre-installed and configured on the hosts:
| Host | Component | Version | Comment |
|---|---|---|---|
| Monitoring host | OpenJDK | 8 | |
| Elasticsearch | 6.6.x | Install via RPM | |
| Logstash | 6.6.x | Install via RPM | |
| Kibana | 6.6.x | Install via RPM | |
| Monitored host | OpenJDK | 8 | |
| Filebeat | 6.6.x | Install via RPM | |
| Heartbeat | 6.6.x | Install via RPM | |
| Journalbeat | 6.6.x | Install via RPM |
Required software
When targeting nevisAppliance, Filebeat, Heartbeat and Journalbeat are preinstalled. There is currently no dedicated nevisAppliance with Elastic Stack (Elasticsearch, Logstash and Kibana).Patterns
The following patterns are shipped out-of-the-box in this plug-in:
Elastic Stack Instance
The Elastic Stack Instance pattern allows setting up and deploying the open source Elastic Stack components (i.e., Elasticsearch, Logstash, and Kibana) on a single target host; clustering is not supported. It acts as a monitoring stack.
The connection between Filebeat and Logstash is one-way SSL. Elasticsearch binds to localhost, so it is secure by design. However, Kibana binds to 0.0.0.0 and this is not configurable. For production setups, this means that protect it behind nevisProxy and add some manual security settings. See Elastic Kibana Web Application.
How to add an Elastic Stack instance
Click on the image to repeat the movie.
If you want to access Kibana web application directly and without protecting it behind nevisProxy, you don't add an Elastic Kibana Web Application pattern to the Elastic Stack Instance pattern. Direct access to Kibana without nevisProxy is possible.
Elastic Beats Instance
The Elastic Beats Instance pattern sets up Elastic Beats (that is, Filebeat, Journalbeat and Heartbeat) to ship log files, the syslog and the status of monitorable components to Elastic Stack. It comes with default cleanup settings, which delete all data (logs, syslog and status data) older than x days.
How to add an Elastic Beats instance
Click on the image to repeat the movie.
The next table lists the log files that are monitored:
| Component | Log type | Log files |
|---|---|---|
| nevisProxy | nevisproxy-navajo | /var/opt/nevisproxy/*<instance-name>*/logs/navajo.log |
| nevisproxy-access | /var/opt/nevisproxy/*<instance-name>*/logs/access.log | |
| nevisproxy-events | /var/opt/nevisproxy/*<instance-name>*/logs/nevisproxy-events.log | |
| nevisproxy-apache | /var/opt/nevisproxy/*<instance-name>*/logs/apache.log | |
| nevisAuth | nevisauth-audit | /var/opt/nevisauth/*<instance-name>*/log/audit.log |
| nevisauth-esauth4sv | /var/opt/nevisauth/*<instance-name>*/log/esauth4sv.log | |
| nevisauth-events | /var/opt/nevisauth/*<instance-name>*/log/nevisauth-events.log | |
| nevisIDM | nevisidm-application | /var/opt/nevisidm/*<instance-name>*/log/application.log |
| nevisidm-audit | /var/opt/nevisidm/*<instance-name>*/log/audit.log | |
| nevisidm-batch | /var/opt/nevisidm/*<instance-name>*/log/batch.log | |
| nevisidm-events | /var/opt/nevisidm/*<instance-name>*/log/nevisidm-events.log |
Elastic Kibana Web Application
The open source Kibana application is not protected by default. Because it gives access to sensitive log data, we recommend the following approach:
- Configure your Elastic Stack Instance (see above) to run on a host inside a well-protected network zone, usually not reachable from the Internet.
- Additionally, set up a nevisProxy instance on the same host, or on a host with similar protection measures.
- Add the Elastic Kibana Web Application pattern as documented below.
- Configure an Authentication Realm to restrict access to authenticated users.
- Lock down non-proxied access to Kibana. This must be done on the host where the Elastic Stack Instance runs. See Manual Security Configuration below.
The Elastic Kibana Web Application pattern configures nevisProxy to make the Kibana web application accessible on the /kibana URL.
In the pattern, optionally configure an Authentication Realm pattern to restrict access to authenticated users, for example nevisIDM users. See also Configuring Authentication Use Cases.
How to add an Elastic Kibana Web Application instance
Click on the image to repeat the movie.
After configuring and deploying Kibana, you can access the Kibana web application via the frontend URL. The exact URL can be found via the Service Mapping Report. The movie below shows it in action:
How to access a Kibana application protected by nevisProxy
Click on the image to repeat the movie.
Manual Security Configuration
Once the Kibana web application is secured behind nevisProxy, we must manually restrict its direct access. This needs to be done by adding firewall rules to the deployment host of the Elastic Stack Instance (this is where the Kibana web application backend actually runs):
Add these firewall rules on Kibana host (RHEL 7)
# Considering Kibana runs on default port 5601 and a.b.c.d being the IP address of nevisProxy Host
iptables -A INPUT -p tcp --dport 5601 -s a.b.c.d -j ACCEPT
iptables -A INPUT -p tcp --dport 5601 -j DROP
iptables-save > /etc/sysconfig/iptables
systemctl enable iptables
systemctl start iptables
See also