Normalization section
An important step in the risk detection process is the calculation of the normalized risk score, also callednormalization. The goal of the normalization process is to create one single measurement for the risk of an HTTP request, based on the various risk scores coming from the different detection technologies or plug-ins. For this, nevisDetect aggregates the risk scores of all involved detection technologies into a single numerical value between 0.0 and 1.0. This is the normalized risk score.
The configuration of the normalized risk score is based on two elements:
- The configuration of the plug-in risk scores (which serve as input for the calculation of the normalized risk score).
- The computation algorithm used to calculate the normalized risk score.
The configuration of the normalized risk score happens in the Normalizationsection. This section allows you to create and test several normalization models. You also define here which data you want to use for the training and testing of your models.
The Normalization section contains the following views: Training data, Normalization models and Normalized risk scores.
For more information on the calculation of a normalized risk score, see Normalization in the nevisDetect reference guide.
Training data
The Training data view allows you to define which plug-in risk scores you want to use for the training and testing of your normalization models. First, you need to specify the conditions of storing the risk scores. Then you can define training data sets, by selecting risk scores and setting a time frame.
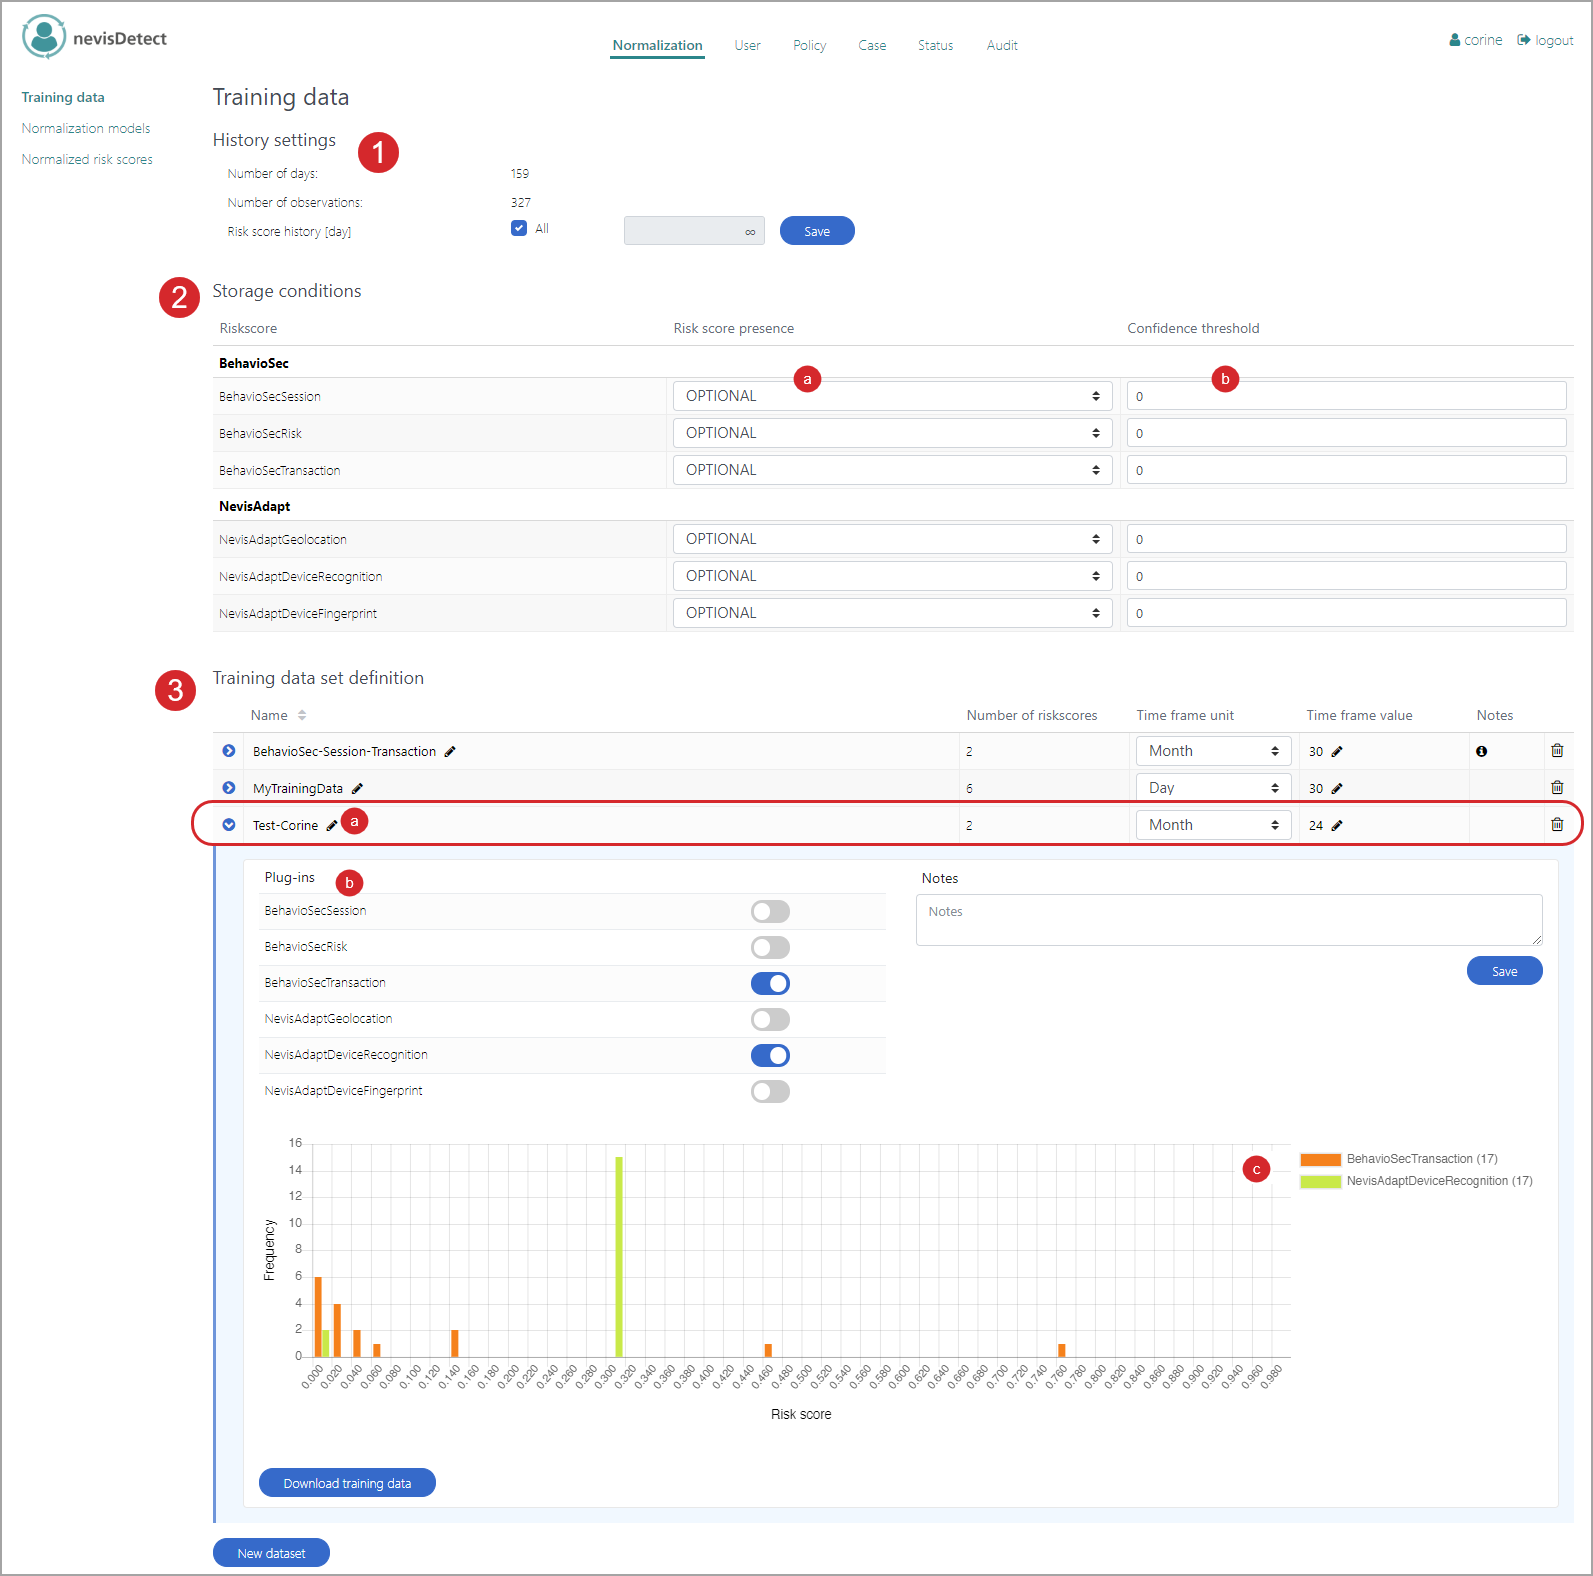
The Training data view consists of several parts, see the figure above - the numbers in the figure correspond with the numbers below.
- The History settings field specifies the history settings.
- You define the storage condition per plug-in risk score in the Storage conditions field. A storage condition consists of a qualifierregarding the presence of the plug-in risk score, and a numeric confidence threshold.
- The Risk score presence field shows the qualifier for the presence of the risk score. Some detection technologies cannot deliver a risk score for every HTTP request. For your training purposes, such HTTP requests might be useless, as they do not deliver the complete set of risk scores. The Risk score presence field defines how to deal with such requests, per risk score. The following values for the qualifier are defined:
- IGNORE means that the respective plug-in risk score will never be stored.
- REQUIRED means that the presence of this plug-in risk score is required. If the plug-in risk score is not present for the HTTP request, no plug-in risk scores at all will be stored for the corresponding HTTP request.
- OPTIONAL means that the plug-in risk score is optional. It will be stored if present. This setting has no influence on the storage of the HTTP request's other plug-in risk scores.
- The confidence threshold is set in the Confidence threshold field. It has a numeric value between 0 an 1. The confidence level of a risk score shows how confident nevisDetect is about the correctness of a risk score value. If the confidence of the plug-in risk score is below the threshold, the risk score will not be stored.
- The Risk score presence field shows the qualifier for the presence of the risk score. Some detection technologies cannot deliver a risk score for every HTTP request. For your training purposes, such HTTP requests might be useless, as they do not deliver the complete set of risk scores. The Risk score presence field defines how to deal with such requests, per risk score. The following values for the qualifier are defined:
- The Training data set definition field shows the configuration of the training data sets. These data sets are used for training and testing your normalization models (and as such for calculating the normalized risk score). The Training data set definition field lists the available training data sets.
- Each entry of a training data set includes the following elements:
- The name of the data set. A normalization model refers to a training data set by this name.
- The number of plug-in risk scores that are included in the training data set.
- The time frame to consider. The field Time frame unit shows the time unit ("Day" or "Month"). The field Time frame value displays the number of units. For example, the time frame unit "Month" and time frame value "12" mean that all relevant risk scores from the past year (12 months) are included in the training set.
- The field Plug-ins shows all detection plug-ins whose risk scores are part of the training data set. These plug-ins are enabled (the respective button is blue).
- The graphical overview shows the number of available (stored) risk scores, per detection plug-in and divided over the risk score values. Note that each plug-in has its own color, as you can see in the figure (at "c"). If you want to exclude risk scores of a specific plug-in from the graphic, click on the corresponding color bar.
- Each entry of a training data set includes the following elements:
The number of the selected plug-in risk scores defines the dimension of the training data set, whereas the time frame defines the size. Due to computational reasons, the total amount of training data must be limited. However, you can configure several training data sets without influencing the storage space.
For more information on the training data, see Training data in the nevisDetect reference guide.
Normalization models
You can configure, train and test normalization models in the Normalization models view.
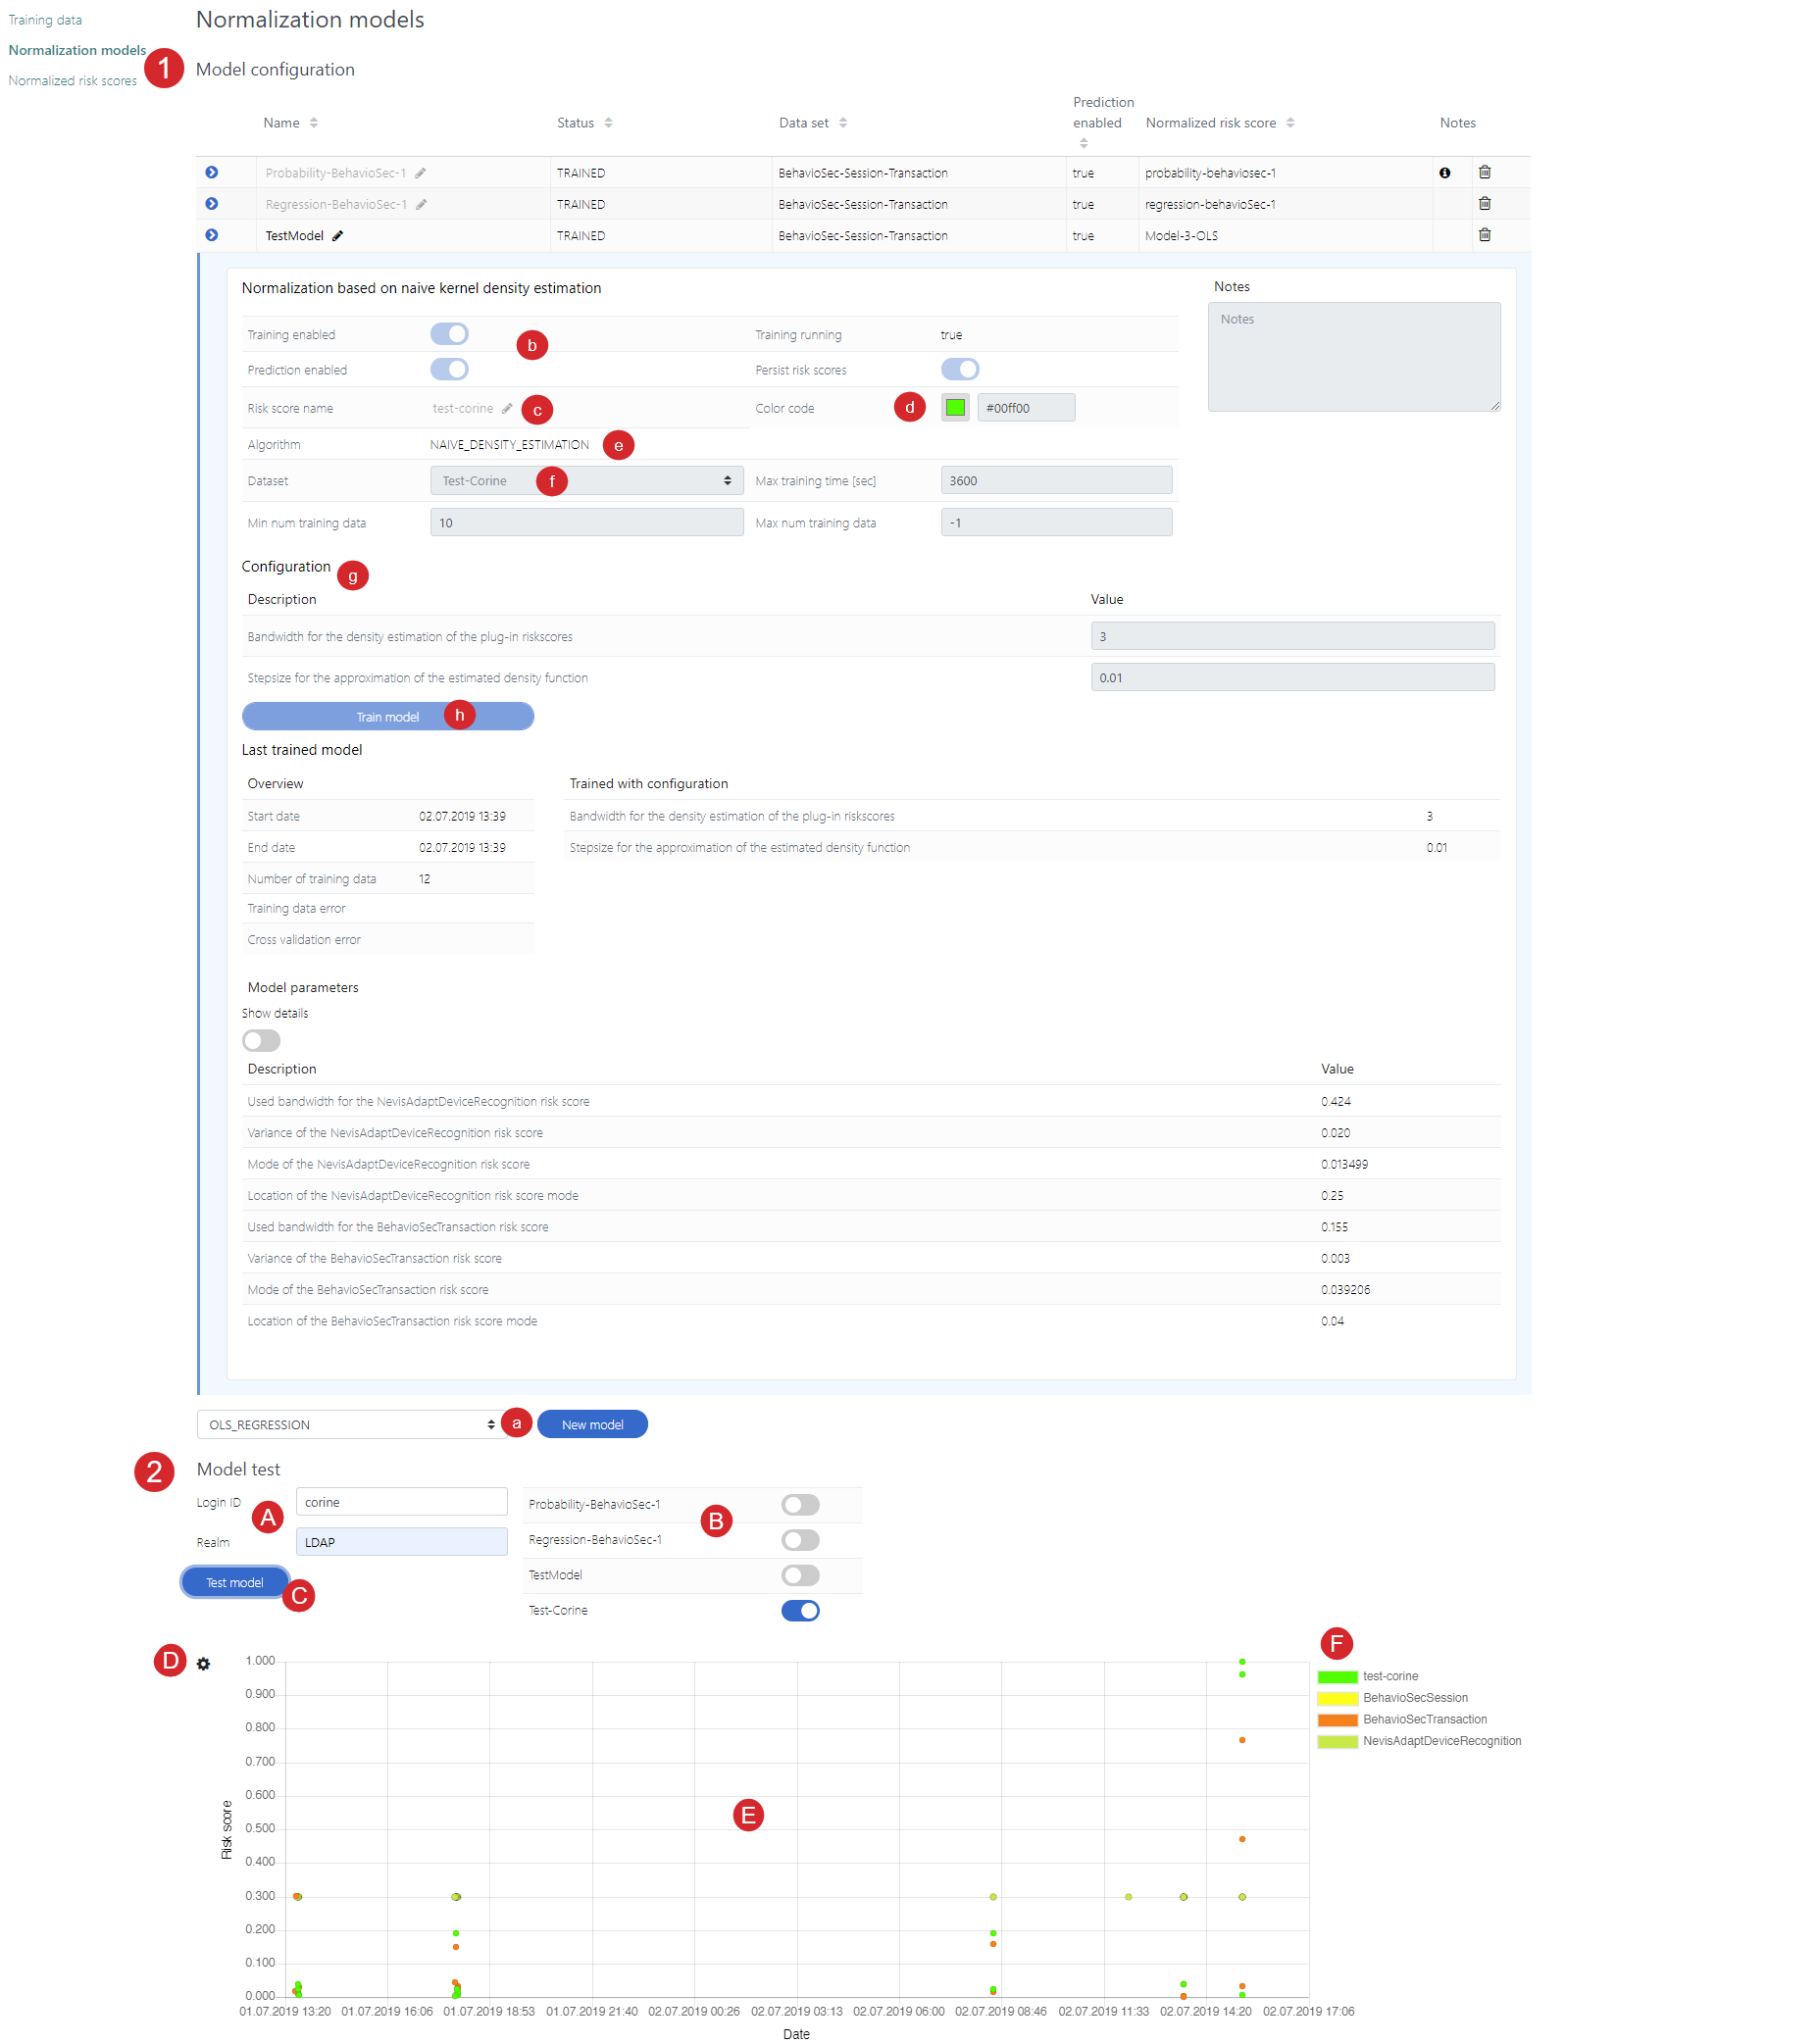
The Normalization models view consists of several parts (see the [figure above].
- You configure a new normalization model in the Model configuration part of the Normalization models view. The Model configuration part contains the following elements:
-
A normalization model is based on a normalization algorithm. Select this algorithm before you can create a new model (see "a" in the figure).
The following algorithms are available:
- OLS regression model
- SVR regression model
- Naive density estimation
- Minumum weighted risk scores
- Maximum weighted risk scores
- Sum weighted risk scoresFor a description of all available normalization models, see Normalization models in the nevisDetect reference guide,
-
Each normalization model includes some general settings, such as whether training or prediction are enabled (button *Training enabled /*Prediction enabled) or whether the risk scores are stored (button Persist risk scores).
-
The field Risk score name shows the name of the normalized risk score calculated by this normalization model. This name is used in all graphical overviews.
-
The Color code field defines the color in which this normalized risk score is shown in graphical overviews.
-
The Algorithm field displays the selected normalization algorithm.
-
The field Dataset defines the data set to use for training your model. The data sets you can choose here are the ones you defined in the Training data view, see Training data.
-
The Configuration field allows you to specify settings that are specific for this respective normalization model.
-
Clicking the Train model button triggers the training of your model. The training details appear below the button as soon as the training is finished.
-
- The Model test part of the Normalization models view defines the settings for testing your normalization models. This part contains the following elements:
-
The models are tested for a specific user, which you define in the Login ID field (by entering the user's login ID). The Realm field allows setting the relevant authentication realm (see "A" in the previous figure).
-
All available normalizations models are listed next to the Login ID and Realm fields (see "B" in the figure). Enable the ones you want to include in the test. You can test several models at once.
-
Clicking the Test model button triggers the testing of the selected normalization model(s) - see "C" in the figure.
-
Click the Settings icon to set the test time frame ("D" in the figure).
-
The graphic below the Test model button shows the test result. That is, the risk scores for the HTTP requests made by the respective user during the defined time frame. See "E" in the previous figure. Each risk score is displayed as a colored dot. The meaning of the colors is explained next to the graphic (see "F" in the figure). In our example, dots with a bright green color represent the normalized risk score "test-corine". This is the name of the risk score calculated by our sample normalization model "Test-Corine". You define the name of a risk score and the color of the dots when defining the corresponding normalization model. See also "c" and "d" in the previous figure.
Note that the graphic not only shows the normalized risk scores, but also the separate risk scores of the various plug-ins. Together, these plug-in risk scores make up the normalized risk score. These plug-in risk scores have another color, as you can see in the figure (at "F"). If you want to exclude a specific risk score from the graphic, click on the corresponding color bar (at"F" in the figure).
-
Normalized risk scores
The Normalized risk scores view shows the persisted and stored normalized risk scores for the defined normalization models. It also displays statistic details for each model.
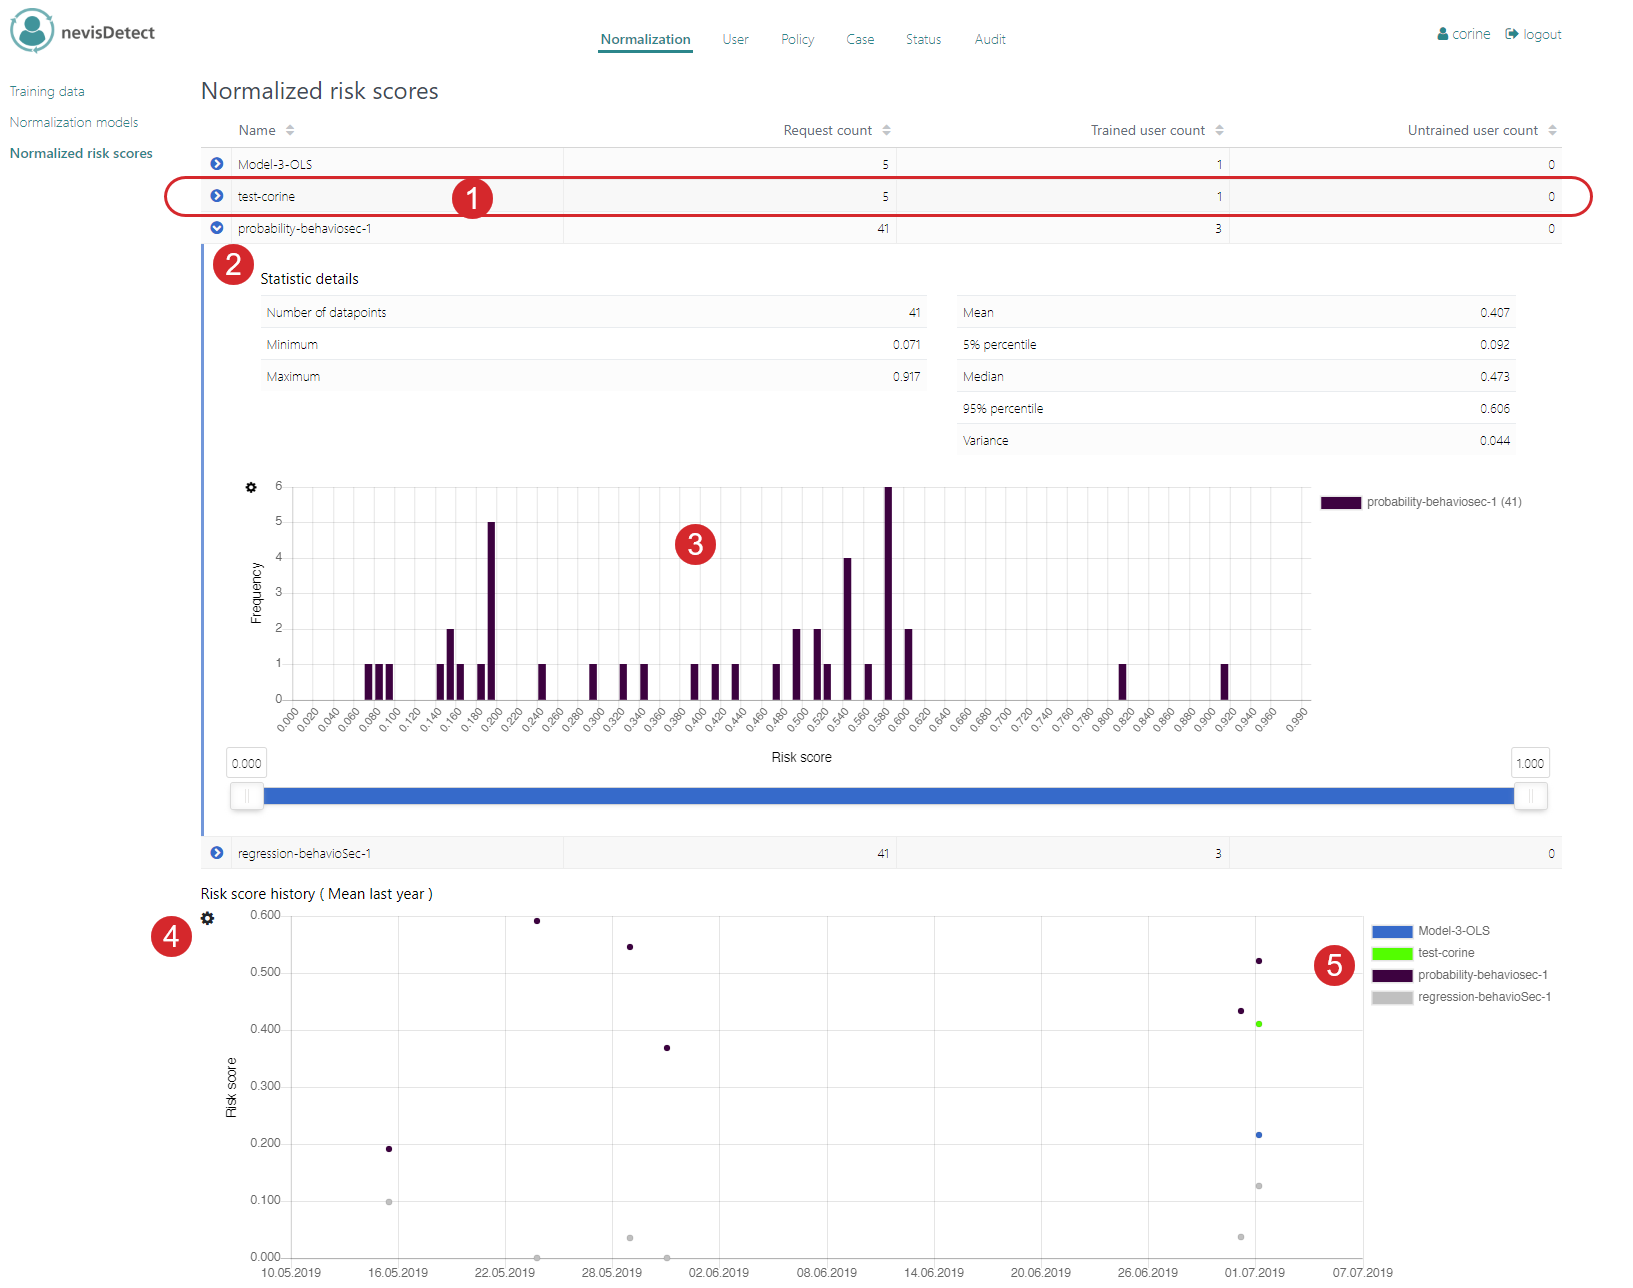
The Normalized risk scores view consists of several parts (see the [figure above].
- The upper part of the view lists the defined normalization models. Each model entry includes
- The name of the model.
- The number of requests for which nevisDetect calculated a normalized risk score based on this model.
- The number of trained users, for whose HTTP requests nevisDetect calculated a normalized risk score based on this model.
- The number of untrained users, for whose HTTP requests nevisDetect calculated a normalized risk score based on this model.
- Clicking the Expand icon will show the statistic details of the model, in the Statistic details field. This includes the number of datapoints (calculated normalized risk scores for this model), the minimum and maximum values of all calculated normalized risk scores for this model, and statistic values as the mean, median and variance.
- The Statistic details field also shows how often a specific normalized risk score appeared within a specific time frame for this normalization model. Click the Settings icon to set the time frame.
- The Risk score history field gives a graphical representation of the normalized risk scores for all models, within a specific time frame. Click the Settings icon to set the time frame and the type of risk score value (the mean, median, 5% or 95% percentile).
- In the graphic, all risk scores are displayed as colored dots. Each color represents a specific normalization model. The meaning of the colors is explained next to the graphic, see no. 5 in the figure. If you want to exclude a specific risk score from the graphic, click on the corresponding color bar.