User section
The User section displays details about
- the plug-ins integrated with nevisDetect, and
- the users of the application(s) protected by nevisDetect.
The User section contains two views: Plug-in overview and User overview.
Plug-in overview
The view Plug-in overview provides statistical details about each available plug-in.
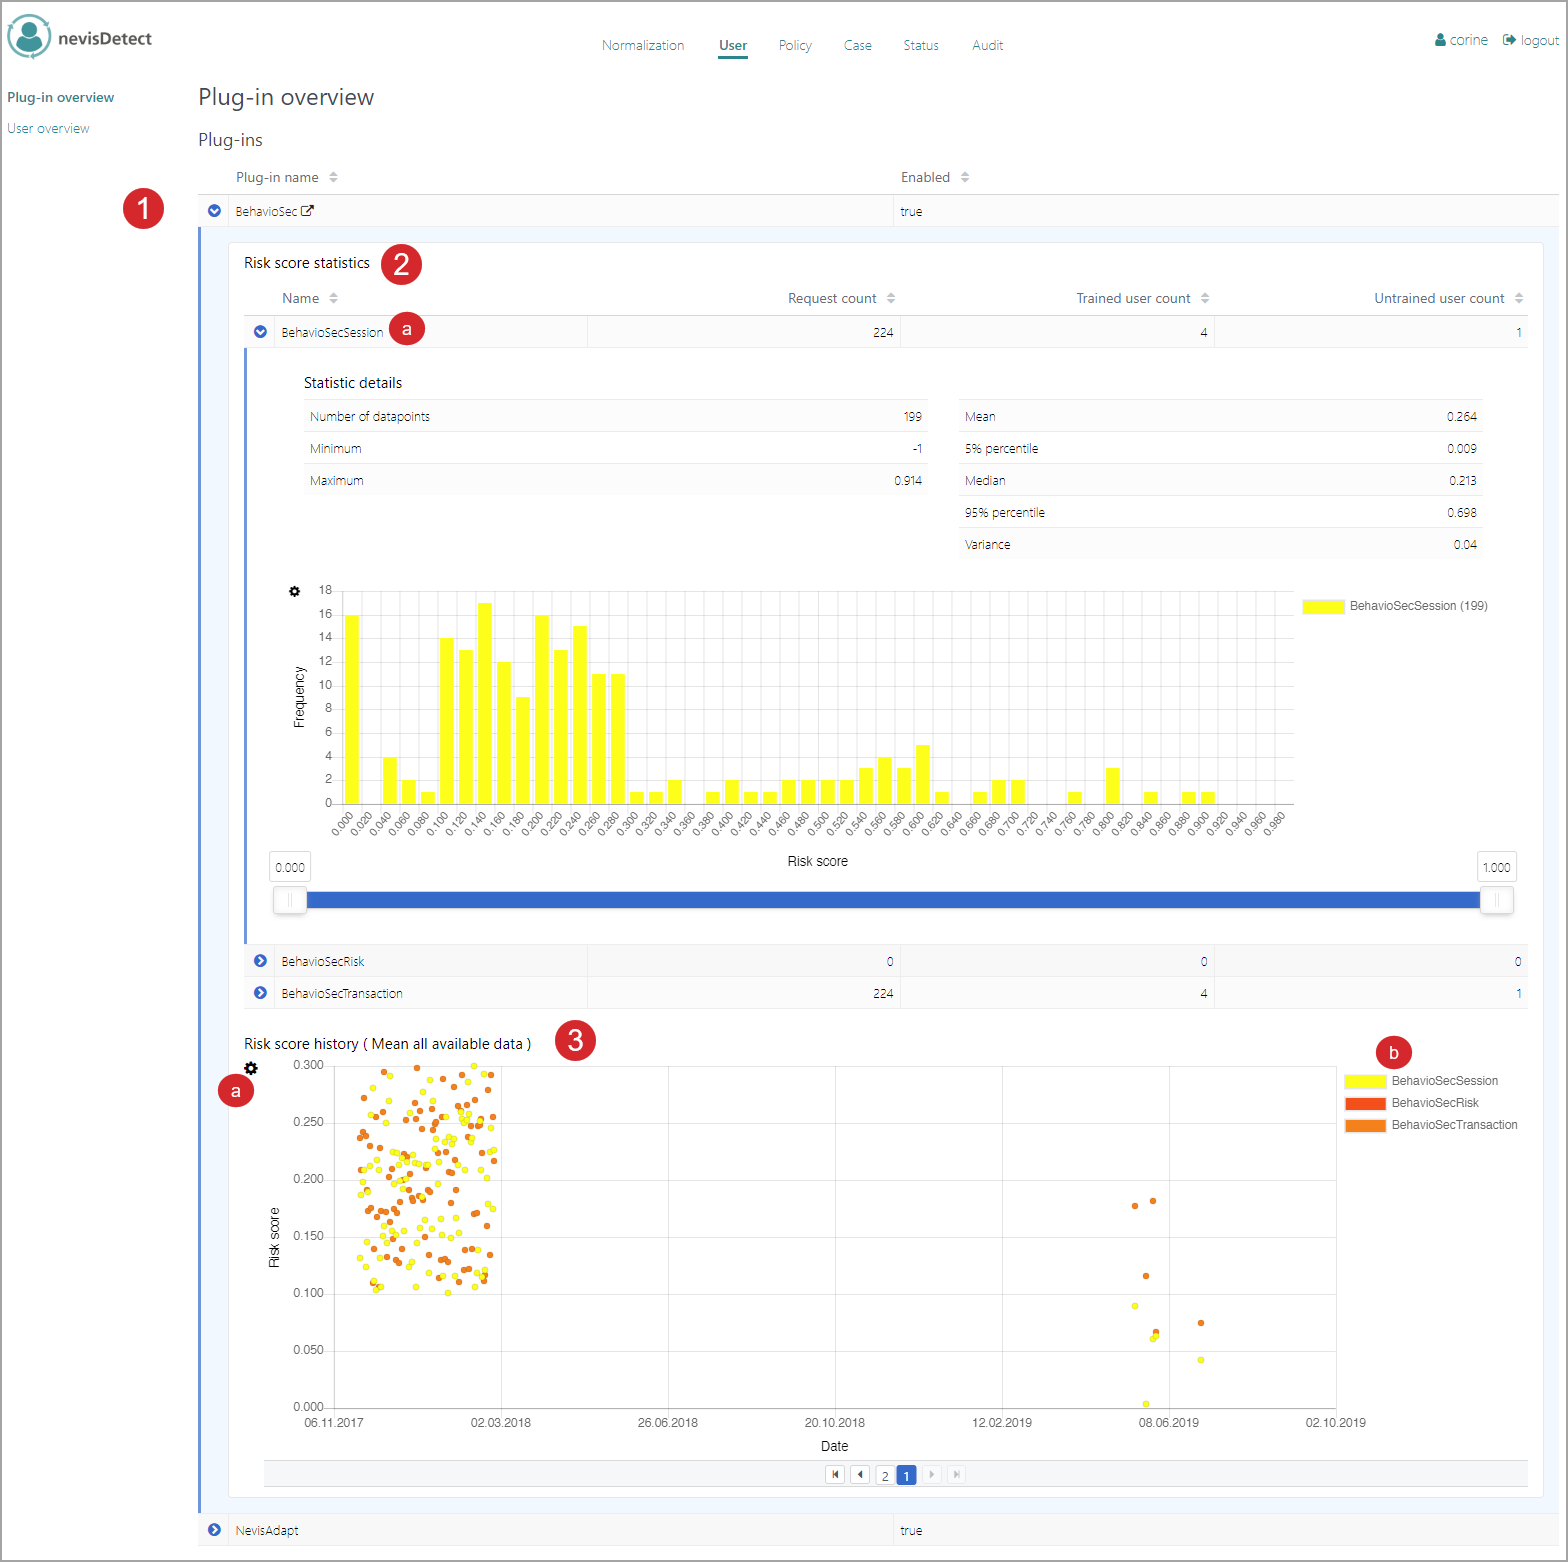
The Plug-in overview view lists all the available plug-ins. It consists of several parts (see the figure above - the numbers in the figure correspond with the numbers below).
- The Plug-ins part lists all available plug-ins. Per plug-in entry, the list shows the name of the plug-in and whether the plug-in is enabled ("true") or not ("false").
- Click the Expand icon to display the plug-in details.
- The Risk score statistics field shows the risk score details up until now for the plug-in. The count of trained requests represents the number of requests for which the detection technology returns a trained response. The count of trained users stands for the number of users whose last request was trained, according to the detection technology. In case of the Proxy plug-in, the custom risk score(s) to be delivered by the plug-in are defined by you. The BehavioSec plug-in and the nevisAdapt plug-in deliver standard risk scores. For an overview, see further below.
- The Risk score history field shows the overall distribution of the plug-in's risk score(s), over the selected time period (e.g., last week, last month, last year). The colors of the dots in the chart correspond with the colors of the blocks on the right side of the chart. Each color represents a different risk score.
- Click the Settings icon to specify the chart settings. Set the time period in the Time frame field. In the Type field, you specify what type of score you want to view: the average value of the risk score (the "mean"), the "5% percentile", the "median" or the "95% percentile".
- To remove a certain risk score from the chart, click on the corresponding entry in the list on the right side of the chart.
Standard risk scores
The BehavioSec plug-in and the nevisAdapt plug-in deliver the following standard risk scores.
The BehavioSec plug-in delivers the following risk scores:
- The BehavioSecTransaction risk score This risk score is based on the behavioral data of the actual HTTP request.
- The BehavioSecSession risk score This risk score is based on the behavioral data of all HTTP requests in the current session.
- The BehavioSecRisk risk score
The nevisAdapt plug-in delivers the following risk scores:
- The NevisAdaptDeviceFingerprintrisk score This risk score is based on a so-called device fingerprint.
- The NevisAdaptGeolocationrisk score This risk score is based on the geolocation of the user.
- The NevisAdaptDeviceRecognitionrisk score This risk score is based on a persistent cookie.
User overview
The view User overview provides statistical details about each user of an application protected by nevisDetect.
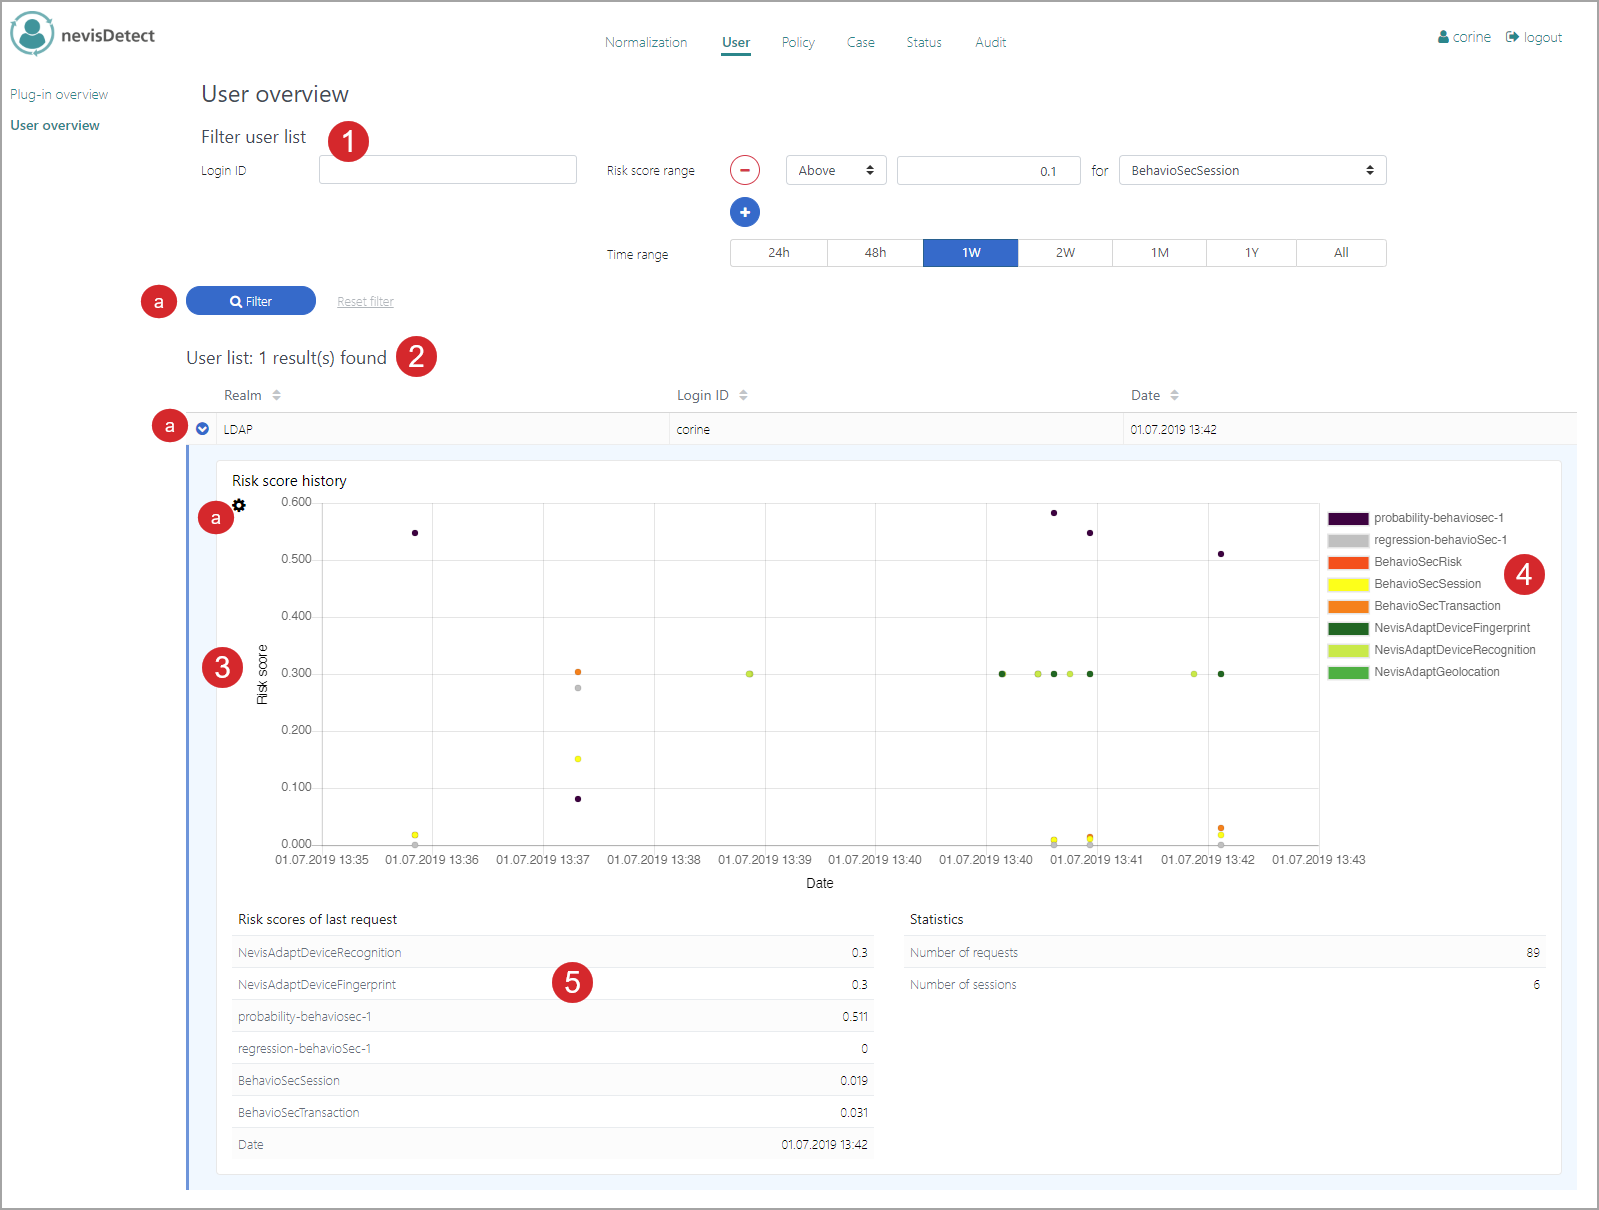
The User overview view lists all users of the applications protected by nevisDetect. It consists of several parts (see the figure above - the numbers in the figure correspond with the numbers below).
- You can search for specific users in the Filter user list part, either by login ID, risk score range, or whitelisted status. It is possible to show all users with risk scores above or below a certain value, or in between two values. You also have to specify the kind of risk score as well as the time period.
- Click Filter to show the list of users that fulfill the filter criteria.
- The User list part lists all users that fulfill the filter criteria. Per user (entry), the list shows the relevant login realm, the login ID, the timestamp of the last risk score calculation for this user as well as the whitelisted status (which can be toggled by authorised administrators).
- Click the Expand icon to display the user's risk score history.
- The Risk score history field gives an overview of the overall distribution of the risk scores for this user, over the selected time period (e.g., last week, last month, last year).
- To specify the time period, click the Settings icon on the left-hand side of the chart.
- The colors of the dots in the chart correspond with the colors of the blocks on the right-hand side of the chart; each color represents a different (plug-in) risk score. To remove a specific risk score from the chart, click the corresponding entry in the list on the right-hand side of the risk score chart.
- The lower section of the Risk score history field shows risk score statistics for the relevant user. The date and time displayed in the Date row correspond with the date of the last request.