Status section
The Status section allows you to manage the application's detection and mitigation process as well as monitor nevisDetect and its components and plug-ins.
The Status section contains two views: Application management and Application monitoring.
Application management
The Application management view shows all components of nevisDetect as well as all available plug-ins. The view allows you to start and stop each individual plug-in as well as all nevisDetect' components at once. You can also set the operation mode (for example, training or detection). Additionally, it is possible to specify the settings of the nevisDetect components. nevisDetect consists of the following components: Feature correlator, Core and Persistency.
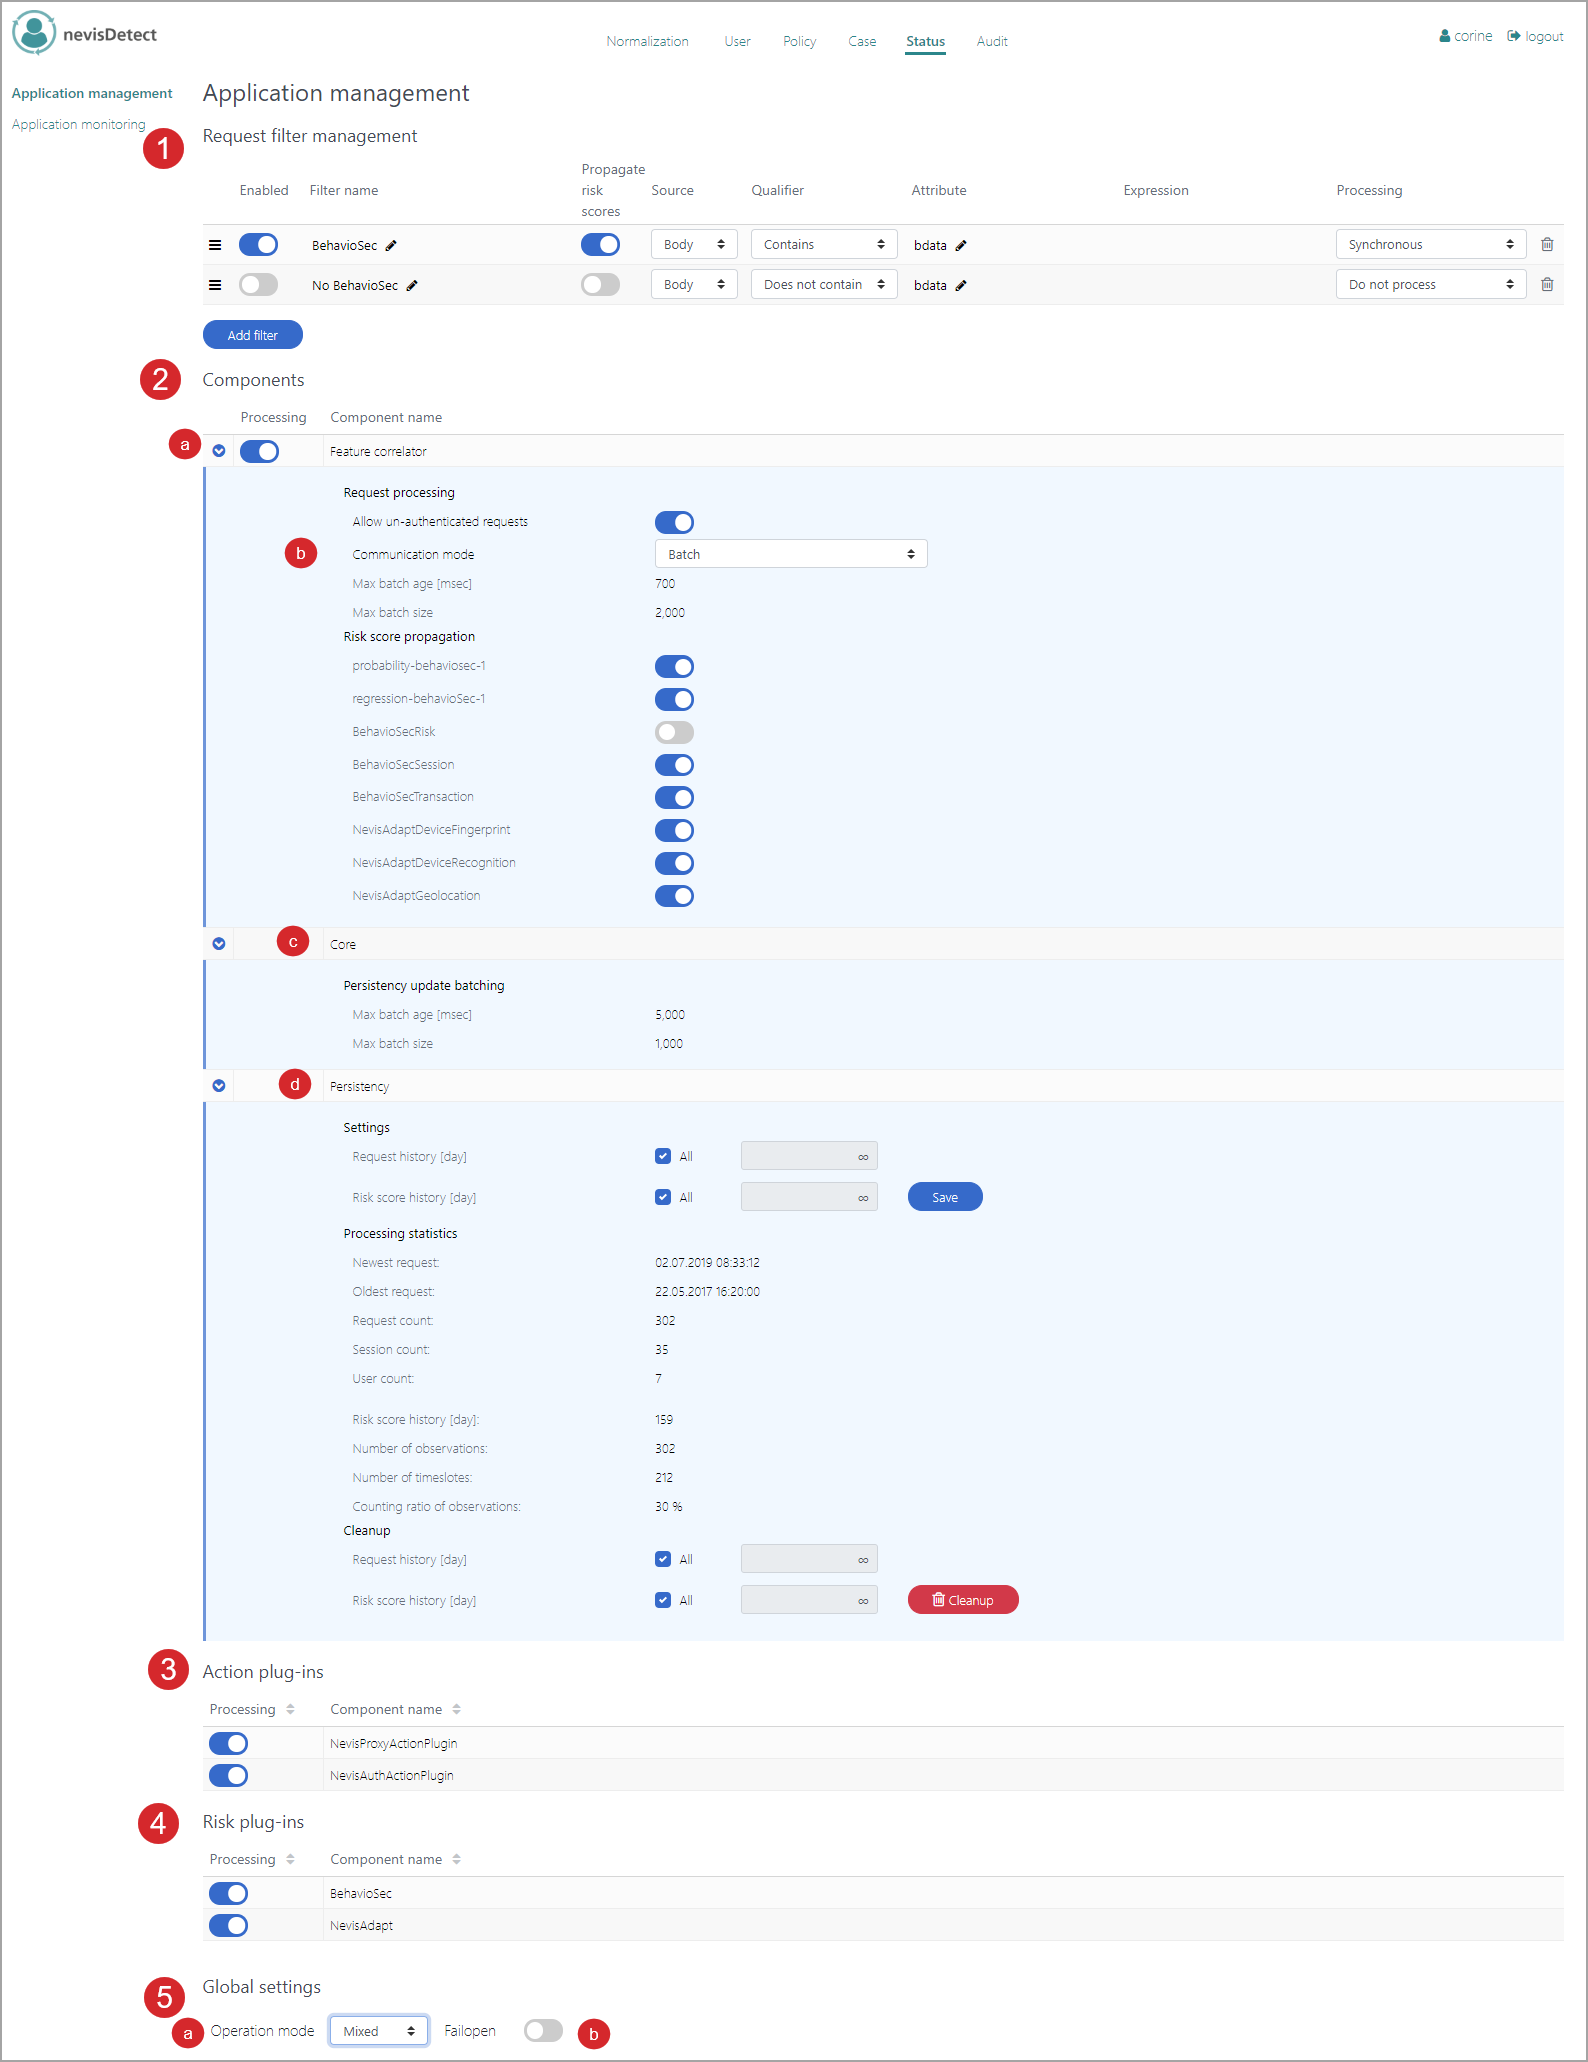
The Application management view consists of several parts (see the figure above - the numbers in the figure correspond with the numbers below).
- In the Request filter management part you define the request filters that are executed during the request processing. For all requests that match the request filter, the system will either overrule the communication mode or not process the request at all.
- The Components part lists all the nevisDetect components.
- To see the details of each component, click the Expand icon on the left.
- You define the settings of the request processing in the Feature correlator section. This includes settings such as whether to allow un-authenticated requests or how nevisDetect propagates a generated rule to nevisProxy. This last setting is set in the Communication mode field/menu. Use the Risk score propagationbuttons to specify whether to propagate a risk score to the application in the backend. You can specify this for each available risk score. The system propagates a risk score to the backend application in the request header.
- The Core section shows the settings of the persistency update batching, such as the maximum batch age and size.
- The Persistency component/section allows you to execute or configure the clean-up of old requests and request histories.
- The Action plug-inspart lists all available Action plug-ins. You can en- or disable an Action plug-in with the button on the left. A disabled Action plug-in will not execute any actions.
- The Risk plug-inspart lists all available Risk plug-ins. Use the button on the left to en- or disable a risk plug-in.
- The fields below the Risk plug-ins part allow you to specify the general application settings.
- The operation mode is set in the Operation mode field, by selecting one of the available modes ("Training", "Mixed", "Detection") from the drop-down menu.
- The Failopen button specifies the failure tolerance of your system. Suppose you want to block a user when the processing of his request has failed. If so, disable the Failopen button. If you do not want to block such a user, enable the Failopen button.
For more information on how to use the Application management view, see the chapter Security expert.
Application monitoring
The Application monitoring view provides detailed information on all nevisDetect components and all available plug-ins. The view allows the nevisDetect operator to monitor the nevisDetect application and check that everything is fine. However, it is not possible to perform actions through this view.
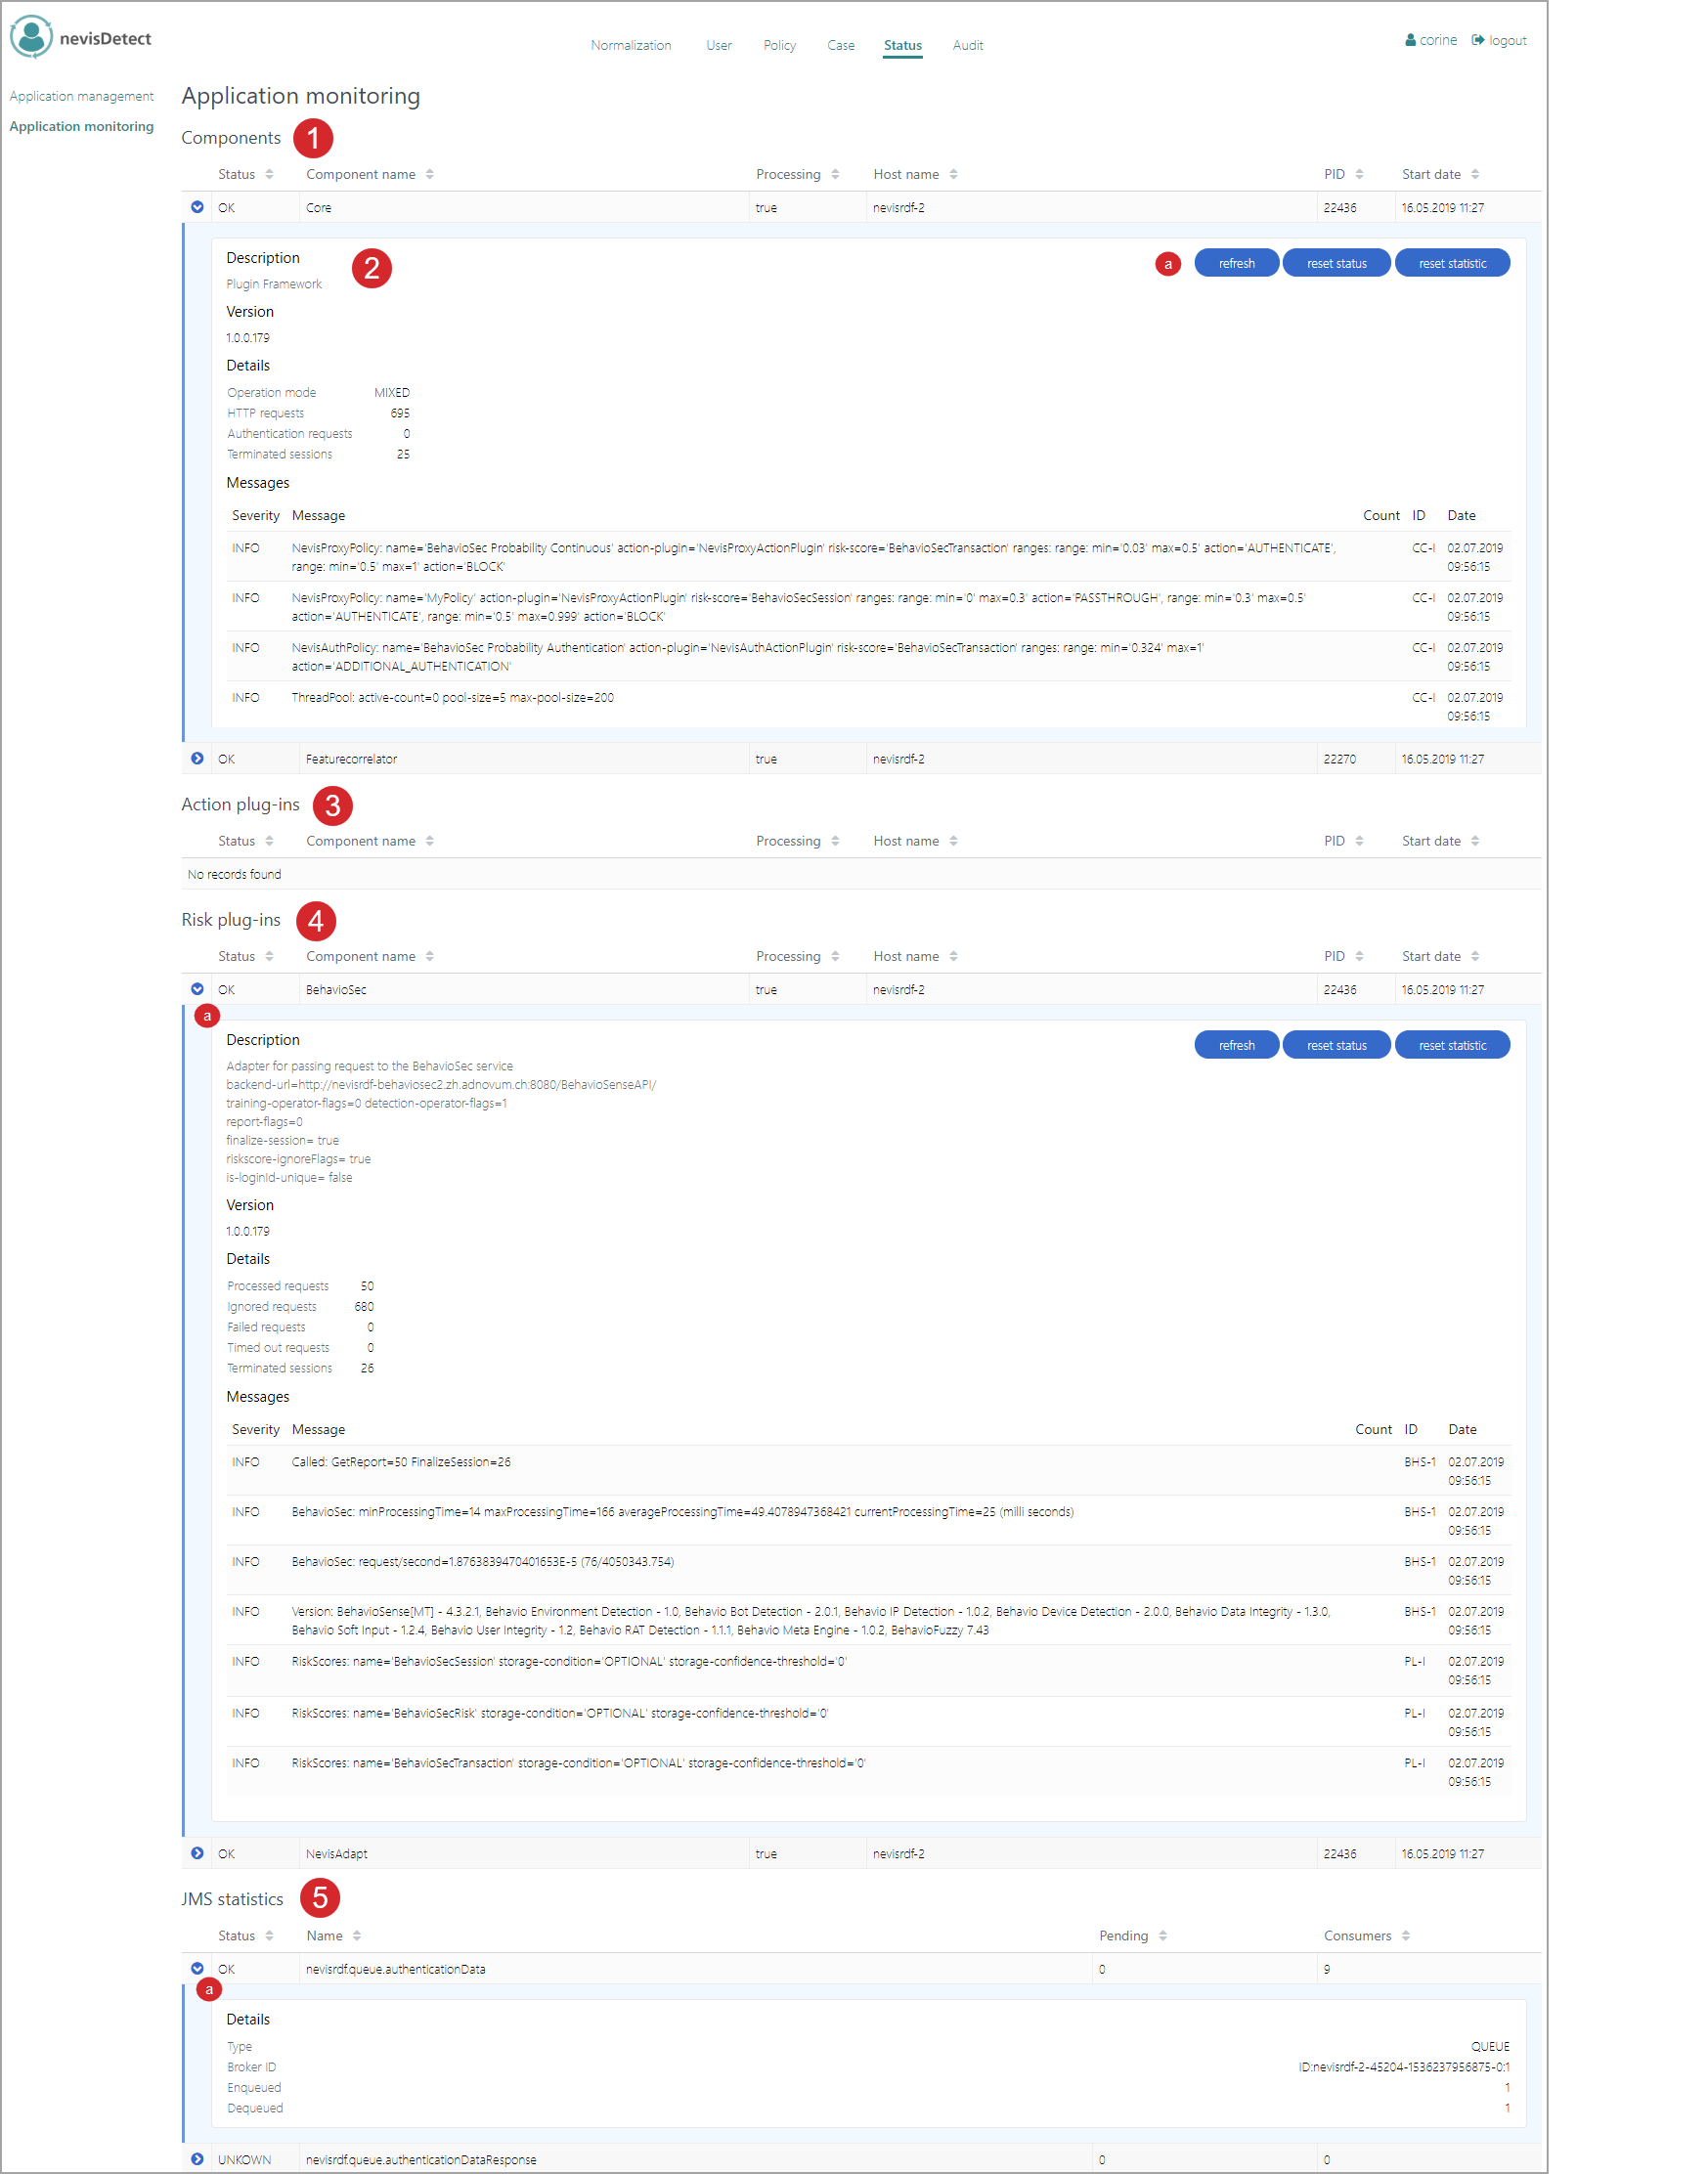
The Application monitoring view consists of several parts (see the figure above - the numbers in the figure correspond with the numbers below).
- The Components part gives detailed information on the nevisDetect components, such as the status, name of the host that runs the application/component, and the last start date and time.
- To view more details of a nevisDetect component, click the relevant Expand icon. The field that opens includes a description of the component and a list of the latest log messages. For a description of the possible log messages, see Description of the monitoring messages.
- The blue buttons give access to some additional actions:
- To display the most up-to-date data, click refresh.
- To reset the status of the component, click reset status.
- To reset the statistics, click reset statistic. As a result, the system sets the statistics for all elements listed under Details (requests, terminated sessions and detection data count) back to "0".
- The blue buttons give access to some additional actions:
- The Action plug-ins part gives detailed information on the available Action plug-ins, such as the status, name of the host that runs the plug-in, and the date and time the plug-in has been started. To view more details of an Action plug-in, click the relevant Expand icon.
- The Risk plug-ins part gives detailed information on the available Risk plug-ins, such as the status, component name, name of the host that runs the plug-in, and the date and time the plug-in has been started.
- To view more details of an Risk plug-in, click the relevant Expand icon. The field that opens includes a description of the plug-in, the version number and request details. There is also a list of the latest log messages. For a description of the possible log messages, see Description of the monitoring messages.
- The JMS statistics part gives detailed information about the Java Messaging System (JMS), such as the status, whether messages are pending and the number of consumers.
- To view more details about a specific element of the JMS statistics, click the relevant Expand icon. The listed details include the type, broker ID and number of enqueued/dequeued messages.
Description of the monitoring messages
Currently only messages of the INFO severity category are described.
Core component
The next table lists the possible monitoring log messages for the Core component.
| Severity | Message example / Description | ID |
|---|---|---|
| INFO | NevisProxyPolicy: name='demo-2' action-plugin='NevisProxyActionPlugin' risk-score='BehavioSecTransaction' ranges: range: min='0.295' max=1' action='AUTHENTICATE' | CC-I |
| This message describes configured and activated nevisProxy policies (technical name: NevisProxyPolicy). | ||
| INFO | NevisAuthPolicy: name='Behaviosec-Login' action-plugin='NevisAuthActionPlugin' risk-score='BehavioSecTransaction' ranges: range: min='0.3' max=1' action='ADDITIONAL_AUTHENTICATION' | CC-I |
| This message describes configured and activated nevisAuth policies (technical name: NevisAuthPolicy). | ||
| INFO | ThreadPool: active-count=0 pool-size=5 max-pool-size=200 | CC-I |
This message shows thread pool data. The message elements have the following meaning: active-count: Number of threads currently in use. pool-size: Current thread pool size. max-pool-size: Maximum number of threads. | ||
| INFO | Messages: minProcessingTime=72 maxProcessingTime=678 averageProcessingTime=301.0 currentProcessingTime=72 (milli seconds) | CC-I |
| This message gives information on the processing times. | ||
| INFO | Messages: request/second=0.004366812227074236 (3/687.0) | CC-I |
| This message shows the messages rate, that is, the number of JMS messages per total processing time. | ||
| INFO | Persistency Batch: enabled='true' current-batch-size='0' max-batch-size='1000' max-batch-age='5000' [msec] (thread-pool-size='5') | CC-I |
This message gives information on the persistency batch. The message elements have the following meaning: current-batch-size: Number of requests currently in the batch. max-batch-size: Maximum batch size. max-batch-age: Maximum batch ageIf the maximum batch size or age is exceeded, the batched data will be sent to the Persistency service. |
Feature Correlator component
The next table lists the possible monitoring log messages for the Feature Correlator component.
| Severity | Message example / Description | ID |
|---|---|---|
| INFO | Rule: rule-id='VKvGmMTl-RqDpDq59pdrVdQKUL_UO2a9m1HPiUPcyoQx' rule-action='BLOCK' user='LDAP/Thomas Bayes' active='true' | FC-I |
This message describes rules. The message elements have the following meaning: rule-id: ID of the rule. rule-action: The action that is related to the rule. user: Realm or login ID of the user addressed by the rule. | ||
| INFO | Request filter: name='BehavioSec missing' enabled='true' processing='false' position='0' communication-mode='null' condition-source='BODY' condition-qualifier='NOT_CONTAINS_FIELD' condition-attribute-name='bdata' condition-expression='null' | FC-I |
This message describes request filters. The message elements have the following meaning: enabled: Flag showing if the request filter is enabled. position: Order position. communication mode: Indicates the communication mode.For more detailed information, see the configuration of the relevant request filter. | ||
| INFO | Requests: minProcessingTime=0 maxProcessingTime=288 averageProcessingTime=22.0 currentProcessingTime=0 (milli seconds) | FC-I |
| This message gives information on the processing times. | ||
| INFO | Requests: request/second=0.01093983092988563 (22/2011.0) | FC-I |
| This message shows the requests rate, that is, the number of HTTP requests per total processing time. | ||
| INFO | Request Batch: current-batch-size='0' max-batch-size='2000' max-batch-age='10000' [msec] (thread-pool-size='4') | FC-I |
This message gives information on the request batch. The message elements have the following meaning: current-batch-size: Number of requests currently in the batch. max-batch-size: Maximum batch size. max-batch-age: Maximum batch ageIf the maximum batch size or age is exceeded, the batched data will be sent as JMS message to Core component. | ||
| INFO | Sending request-modification (propagated risk-scores) | FC-I |
| This message gives information on propagated risk scores. |
Persistency component
The next table lists the possible monitoring log messages for the Persistency component.
| Severity | Message example / Description | ID |
|---|---|---|
| INFO | Messages: minProcessingTime=31 maxProcessingTime=602 averageProcessingTime=343.0 currentProcessingTime=31 (milli seconds) | PC-I |
| This message gives information on the processing times. | ||
| INFO | Messages: request/second=0.003740648379052369 (3/802.0) | PC-I |
| This message shows the requests rate, that is, the number of REST calls per total processing time. |
Risk plug-ins
The next tables lists the possible monitoring log messages for the Risk plug-ins. There are three categories of messages: generic messages, BehavioSec-specific messages and nevisAdapt-specific messages.
Generic messages
The next table lists generic log messages for all Risk plug-ins.
| Severity | Message example / Description | ID |
|---|---|---|
| INFO | RiskScores: name='NevisAdaptDeviceRecognition' storage-condition='OPTIONAL' storage-confidence-threshold='0' | PL-I |
| This message gives information on the plug-in risk scores and their storage condition. | ||
| INFO | BehavioSec: minProcessingTime=29 maxProcessingTime=78 averageProcessingTime=52.0 currentProcessingTime=29 (milli seconds) | BHS-1 |
| This message gives information on processing times. | ||
| INFO | BehavioSec: request/second=0.004366812227074236 (3/687.0) | BHS-1 |
| This message shows the requests rate, that is, the number of requests per total processing time. |
BehavioSec-specific messages
The next table lists BehavioSec-specific monitoring log messages.
| Severity | Message example / Description | ID |
|---|---|---|
| INFO | Called: GetReport=2 FinalizeSession=1 ResetProfile=0 | BHS-1 |
| This message gives information on service calls. | ||
| INFO | Version: BehavioSense[MT] - 4.3.2.1, Behavio Environment Detection - 1.0, Behavio Bot Detection - 2.0.1, Behavio IP Detection - 1.0.2, Behavio Device Detection - 2.0.0, Behavio Data Integrity - 1.3.0, Behavio Soft Input - 1.2.4, Behavio User Integrity - 1.2, Behavio RAT Detection - 1.1.1, Behavio Meta Engine - 1.0.2, BehavioFuzzy 7.43 | BHS-1 |
| This message shows BehavioSec version information. |
nevisAdapt-specific messages
The next table lists nevisAdapt-specific monitoring log messages.
| Severity | Message example / Description | ID |
|---|---|---|
| INFO | Cache size: 1 | NAD-3 |
| This message gives information about the cache size, that is, the number of cached plug-in risk scores. | ||
| NFO | Version: NevisAdapt/1.0.0.0 | NAD-4 |
| This message shows nevisAdapt version information. |