OpenTelemetry monitoring setup
This tutorial guides you through the process of installing a sample monitoring setup using OpenTelemetry that can be used together with the Observability patterns provided by nevisAdmin 4.
The configuration presented here is not intended for production use. For production environments, we strongly recommend utilizing a managed service.
Prerequisites
- Have an existing Kubernetes cluster and have enough permissions to create cluster scoped resources and namespaces.
- Ensure the following software is pre-installed:
- kubectl: Kubernetes command line interface.
- helm: Helm CLI
Infrastructure
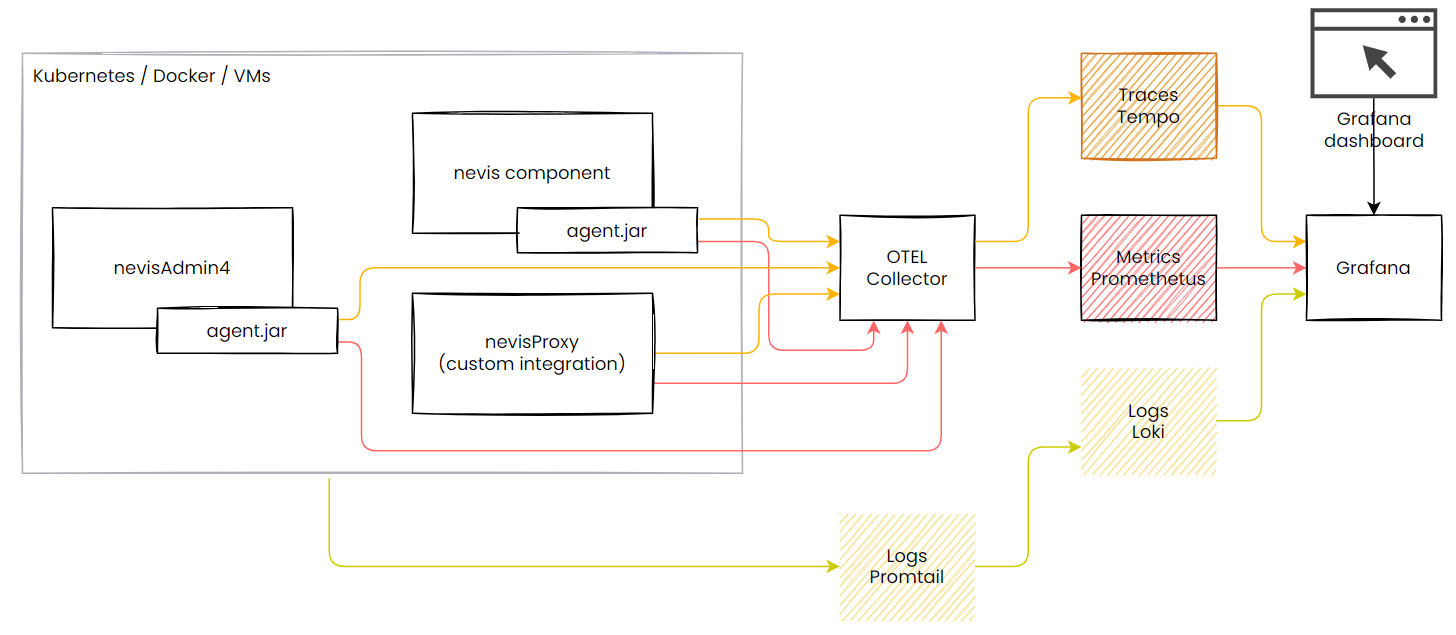
- Grafana Loki is used to store the logs of the Nevis components.
- Promtail is an agent which ships the gathered logs to the Grafana Loki instance.
- Grafana Tempo is a tracing backend. It's used to ingest the traces gathered by the OpenTelemetry Collector.
- Prometheus is used to ingest the metrics gathered by the OpenTelemetry Collector.
- OpenTelemetry Collector receives metrics and traces from the Nevis components using the Observability patterns and forwards them to Prometheus and Tempo.
- Grafana provides visualization for the gathered metrics, traces and logs.
Installation
Grafana Loki
Use the following values file for the installation.
loki-values.yaml
loki:
    auth_enabled: false
    persistence:
        enabled: true
        size: 50Gi
    limits_config:
        retention_period: 24h
    compactor:
        retention_enabled: true
promtail:
    config:
      snippets:
        pipelineStages:
        - match:
            selector: '{app!~"nevis.*"}'
            action: drop
            drop_counter_reason: not_nevis_log
helm repo add grafana https://grafana.github.io/helm-charts
helm repo update
helm upgrade --install --namespace observability --create-namespace loki grafana/loki-stack -f loki-values.yaml
Prometheus
Use the following values file for the installation.
prometheus-values.yaml
alertmanager:
  enabled: false
kube-state-metrics:
  enabled: false
prometheus-node-exporter:
  enabled: false
prometheus-pushgateway:
  enabled: false
server:
  extraFlags:
  -  web.enable-remote-write-receiver
  fullnameOverride: prometheus
  retention: 24h
  persistentVolume:
    size: 25Gi
serverFiles:
  prometheus.yml:
    scrape_configs: []
helm repo add prometheus-community https://prometheus-community.github.io/helm-charts
helm repo update
helm upgrade --install --namespace observability --create-namespace prometheus prometheus-community/prometheus -f prometheus-values.yaml
Grafana Tempo
Use the following values file for the installation.
tempo-values.yaml
tempo:
  retention: 24h
  persistence:
    enabled: true
    size: 50Gi
  metricsGenerator:
    enabled: true
    remoteWriteUrl: "http://prometheus:80/api/v1/write"
helm repo add grafana https://grafana.github.io/helm-charts
helm repo update
helm upgrade --install --namespace observability --create-namespace tempo grafana/tempo -f tempo-values.yaml
OpenTelemetry Collector
Use the following values file for the installation.
otel-values.yaml
nameOverride: "otel-collector"
mode: deployment
presets:
  kubernetesAttributes:
    enabled: true
config:
  receivers:
    otlp:
      protocols:
        grpc:
          endpoint: ${env:MY_POD_IP}:4317
        http:
          endpoint: ${env:MY_POD_IP}:4318
  processors:
    batch: {}
    memory_limiter:
      check_interval: 5s
      limit_percentage: 80
      spike_limit_percentage: 25
  exporters:
    prometheusremotewrite:
      endpoint: http://prometheus:80/api/v1/write
    otlp:
      endpoint: tempo:4317
      tls:
        insecure: true
  service:
    pipelines:
      traces:
        receivers: [otlp]
        processors: []
        exporters: [otlp]
      metrics:
        receivers: [otlp]
        processors: []
        exporters: [prometheusremotewrite]
helm repo add open-telemetry https://open-telemetry.github.io/opentelemetry-helm-charts
helm repo update
helm upgrade --install --namespace observability --create-namespace otel open-telemetry/opentelemetry-collector -f otel-values.yaml
Grafana
Use the following values file for the installation.
grafana-values.yaml
persistence:
  enabled: true
datasources:
  datasources.yaml:
    apiVersion: 1
    datasources:
      - name: Tempo
        type: tempo
        access: proxy
        orgId: 1
        url: http://tempo:3100
        basicAuth: false
        isDefault: true
        version: 1
        editable: true
        apiVersion: 1
        uid: tempo
        jsonData:
          serviceMap:
            datasourceUid: 'prometheus'
          tracesToLogsV2:
            datasourceUid: 'loki'
            spanStartTimeShift: '-10s'
            spanEndTimeShift: '10s'
            filterByTraceID: false
            filterBySpanID: false
            customQuery: true
            query: '{app=~"nevis.+"} |= "$${__span.traceId}"'
      - name: Loki
        type: loki
        access: proxy
        orgId: 1
        url: http://loki:3100
        basicAuth: false
        isDefault: false
        version: 1
        editable: true
        apiVersion: 1
        uid: loki
      - name: Prometheus
        type: prometheus
        access: proxy
        orgId: 1
        url: http://prometheus:80
        basicAuth: false
        isDefault: false
        version: 1
        editable: true
        apiVersion: 1
        uid: prometheus
helm repo add grafana https://grafana.github.io/helm-charts
helm repo update
helm upgrade --install --namespace observability --create-namespace grafana grafana/grafana -f grafana-values.yaml
Follow the instructions shown after the installation is done on how to access the Grafana UI with port forwarding.
The added data sources are available under the /explore path.
Endpoints
With the above setup the following endpoints can be used in the Observability patterns:
tracesEndpoint: http://otel-otel-collector.observability:4318/v1/traces
metricsEndpoint: http://otel-otel-collector.observability:4318/v1/metrics
logsEndpoint: http://otel-otel-collector.observability:4318/v1/logs
Examples
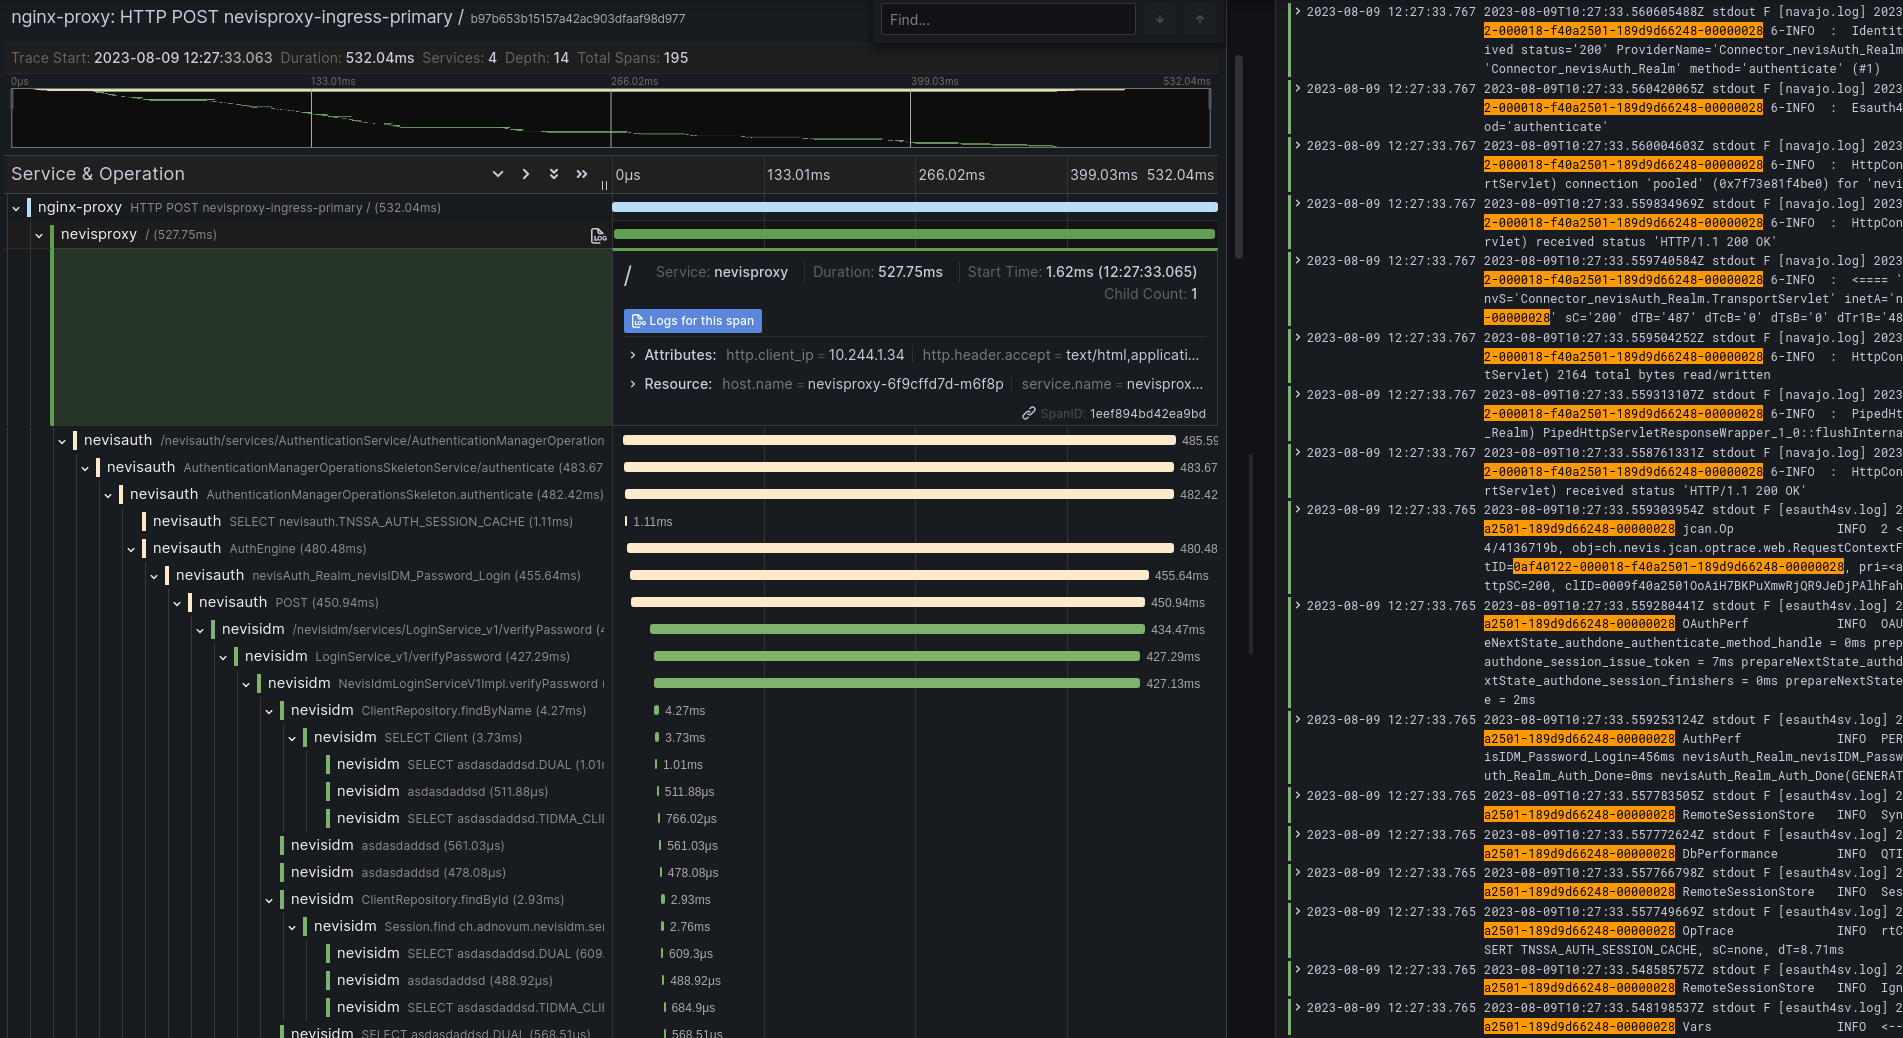
In the following example we can see the traces of a nevisIDM Password Login on the Grafana UI. By clicking on the Logs for this span button, we can also query the logs stored in Loki that contain the relevant nevisProxy TransferID. This is achieved by using the Grafana Trace to logs feature.