Kubernetes Status and Logs
Overview
The Kubernetes Status functionality provides an overview of the status of nevisOperator and the deployed services. It also allows you to check whether the related pods are running properly. Furthermore, you can access and download the logs of nevisOperator and the services per pod, which is useful in case of an issue.
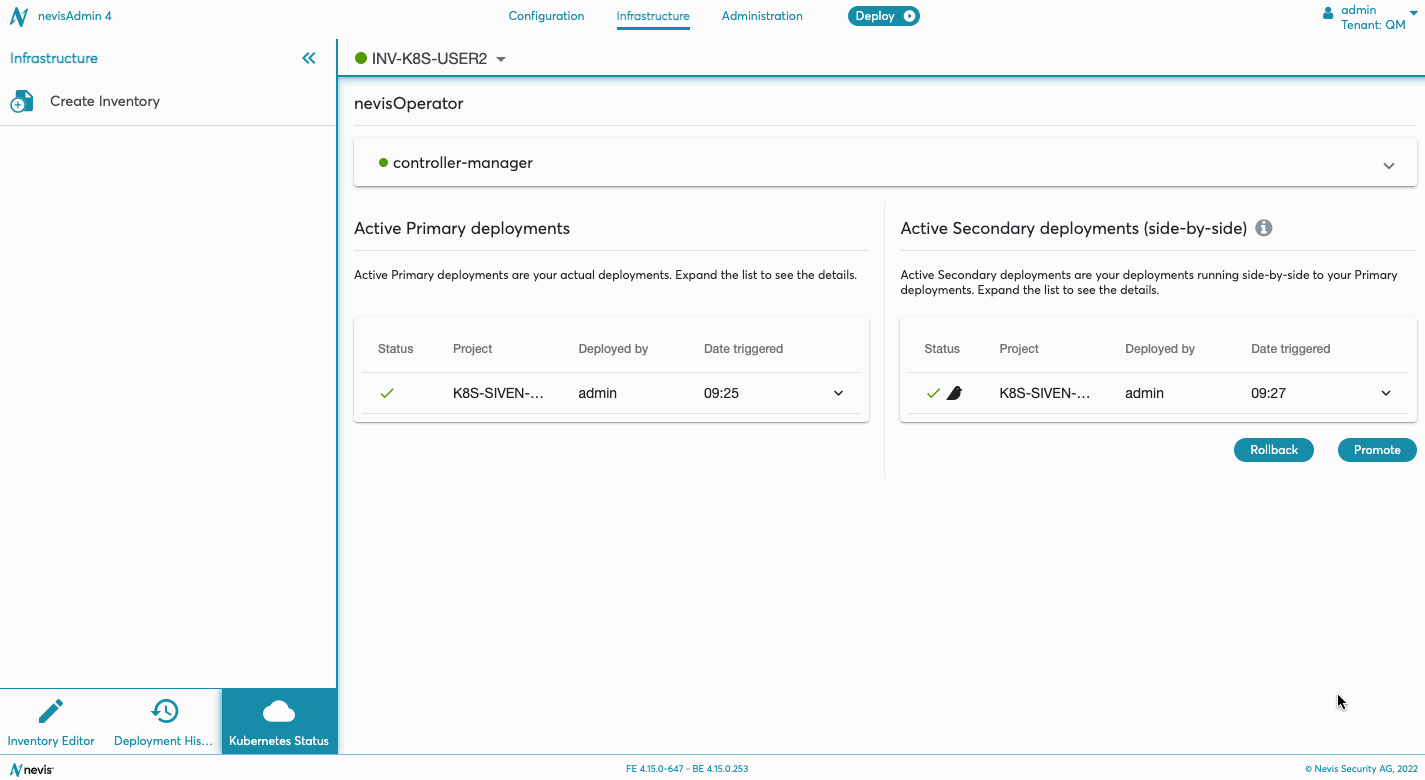
nevisOperator
The nevisOperator related information is displayed at the top of the screen. You can view nevisOperator logs and download them, if needed. The following details are displayed:
- controller-manager with status
- Pod with status, creation time and a link to access the nevisOperator logs
- Docker image
- Docker image repository
Access nevisOperator Logs
To access the nevisOperator logs, perform the following steps:
- In the Kubernetes Status screen, expand the controller-manager section to view the details.
- Click on the view logs link next to the pod in question. This opens the Logs screen, which allows you to view and filter the nevisOperator logs.
The logs are filtered and presented within the selected filters, such as container and time period. In the screen, you can view only the last 200 lines of the logs. However, it is possible to download the log to get the complete overview for the given filters.
The following movie shows how to access and download the logs:
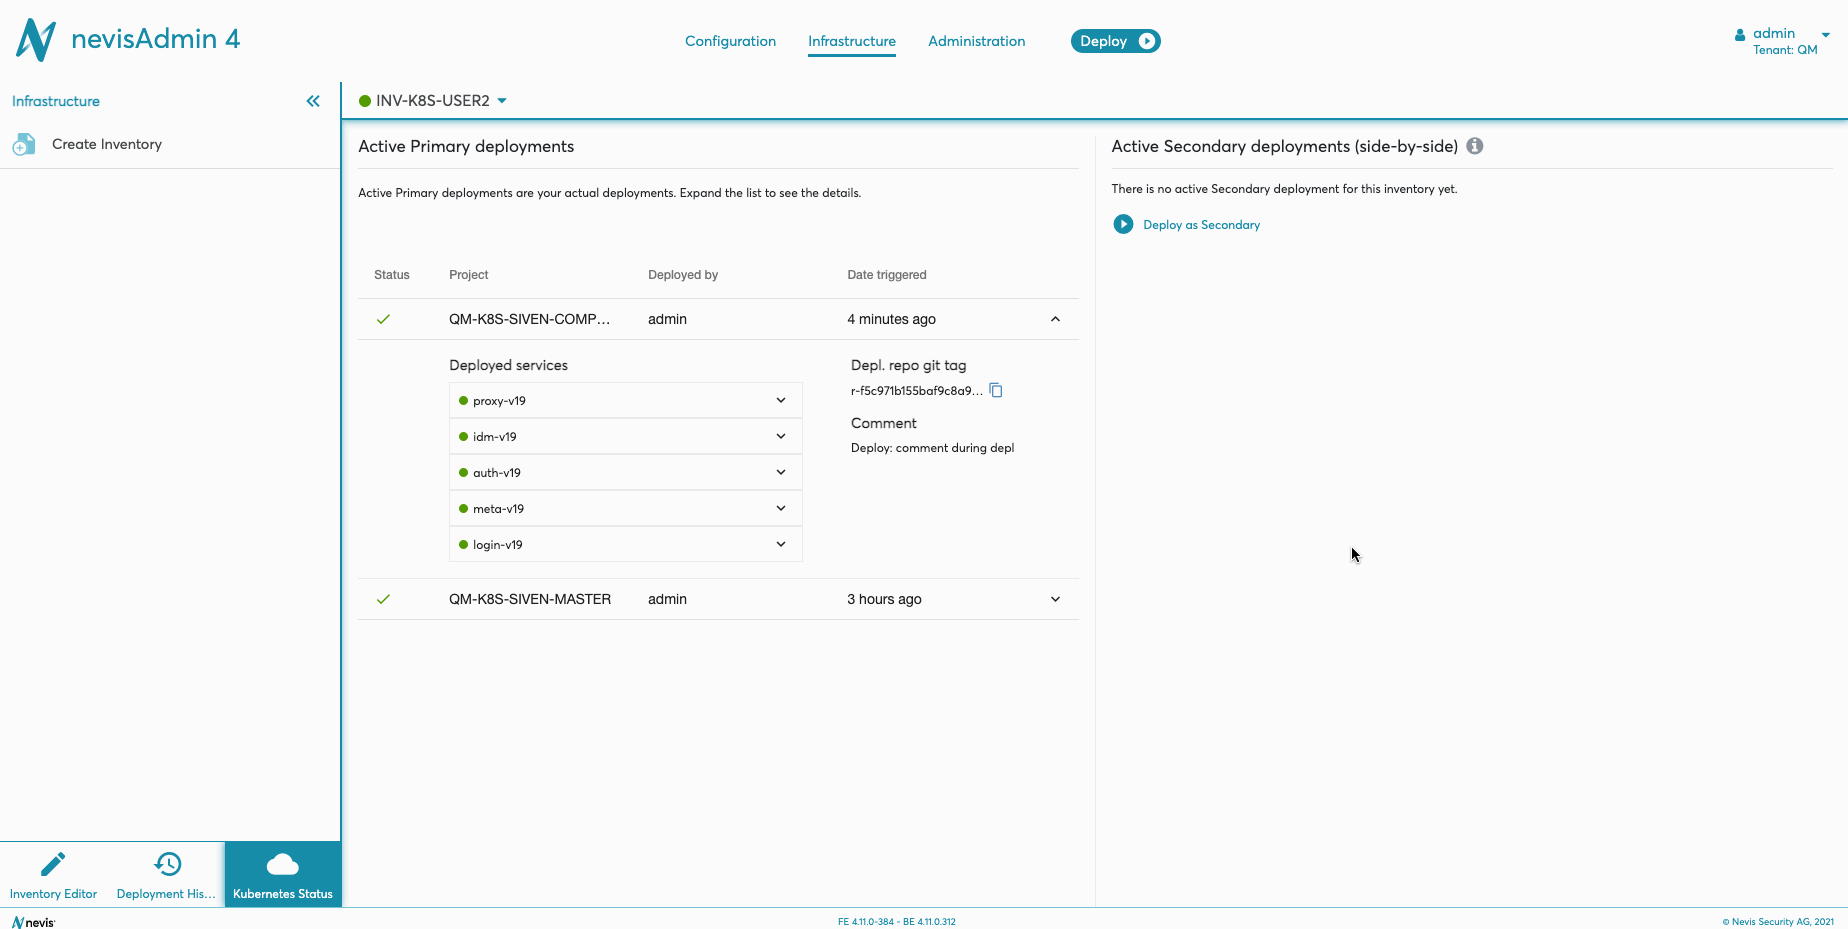
View the Status of Services and Pods
Perform the following steps to view the services, related pods and access the logs:
-
Go to the sidebar of the Infrastructure tab and click on the Kubernetes Status icon to open the Kubernetes Status screen.
-
Find your deployment and open the details section by clicking on the row in the table.
-
Deployed services are highlighted with additional status colors depending on the related pod statuses.
-
Pods are displayed with the statuses and creation time. Note that only the latest migration is shown for each service. Possible pod statuses are:
- Running (ready)
- Succeeded
- Running (unready)
- Pending
- Failed
- Unknown
-
Click on view logs to access the logs per pod.
The following movie shows how to view the service and pod statuses:
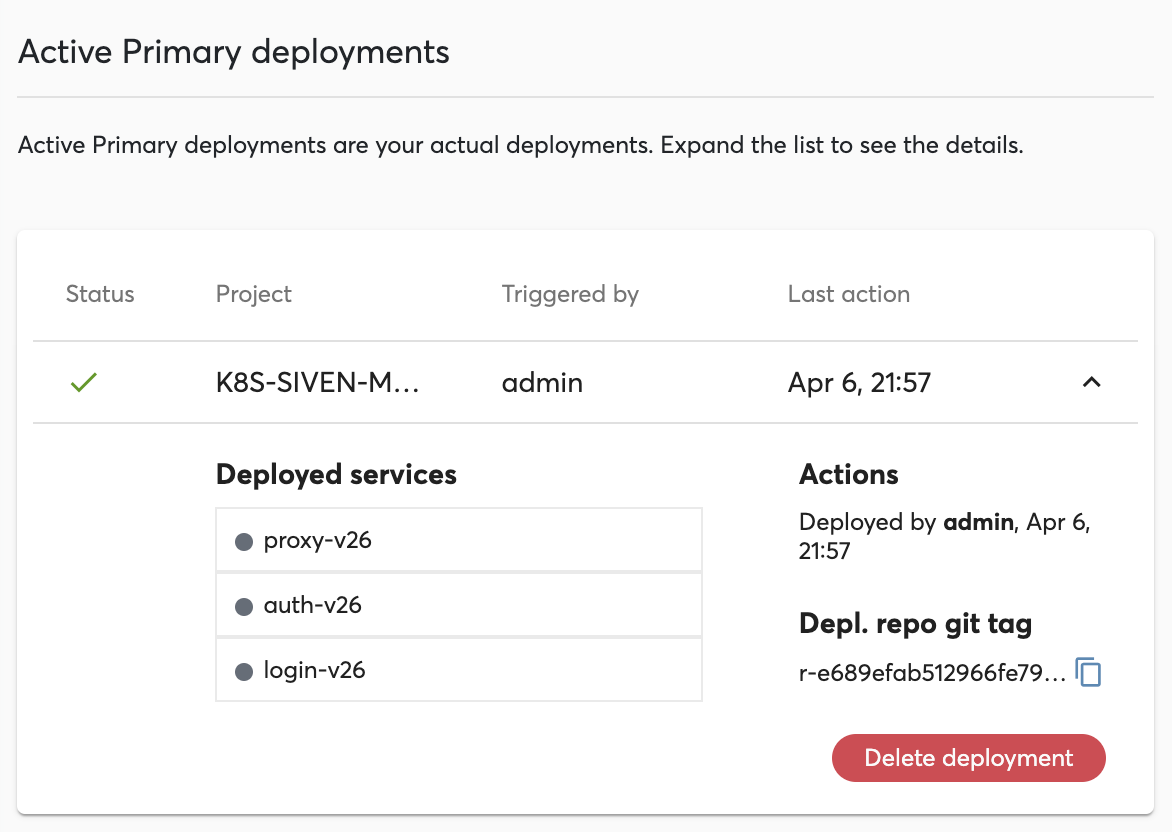
Deleting Deployment
Active primary deployments can be deleted. For this, expand the details section of the deployment, click Delete deployment button and confirm the warning.
Deleting a single deployment may cause issues when you have projects that depend on each other. Please consider making a secondary deployment and promoting it. The secondary deployment also ensures the zero downtime during clean up.
Accessing Logs
To access the logs of a specific pod, perform the next steps:
- In the Kubernetes Status screen, go to the section Deployed services.
- Expand the relevant service to view its pods.
- Click on the view logs link next to the pod in question. This will open the Logs screen, which allows you to view and filter the pod's logs.
Note that the logs are filtered and presented within the selected filters, such as container and time period. In the screen, you can view only the last 200 lines of the logs. However, it is possible to download the log to get the complete overview for the given filters.
The following movie shows how to access and download the logs: